AI is currently running on a one-lane, CAPEX highway that is capacity-constrained. Hyperscalers are the largest contributor to the momentum, and as such, investors keep score with cloud growth rates. But this past quarter, you had to read the footnotes and the fine print to go beyond the massive investments fueling the wave. Microsoft put up eye-popping Azure growth again, but a big part of that acceleration is Azure serving AI inference — notably ChatGPT — now neatly included in the revised definition of what’s included in Azure. This is great for headlines, but not conducive to apples-to-apples comparisons over time. Meanwhile, AWS delivered the largest revenue for cloud infrastructure and sent a clear message that demand exceeds supply, meaning growth is capped by power and components, not pipeline. That creates a weird optics penalty — AWS showing growth in the high teens on a $120B-plus run rate, and it’s deemed “concerning.” But it also telegraphs future upside as capacity goes online and depreciation cycles progress.
The somewhat stealth story is that Google. Google Cloud posted a strong quarterly print with solid top-line growth and steadily improving operating margin — and GCP (the IaaS/PaaS portion of the business) is growing materially faster than cloud overall; our estimate is nearly 40%. Google’s backlog is building at more than $250M, and $1B+ deals continue to close thanks to Google’s underlying tech, a strong data foundation, and its AI prowess. As the mix shifts toward AI-heavy, infrastructure-centric workloads, it becomes a tailwind for Google, which continues to lag the scale of AWS and Azure.
The common thread is a CAPEX arms race that faces real constraints. All three players said that power, sites, servers and lead times will dictate who wins AI inference and who can monetize it. Microsoft is capacity-constrained, AWS says it will take “several quarters” to rebalance, and Google raised its CAPEX guide. As such, we believe strongly that this is not a one-quarter story; it’s a multi-year power grab that will determine margin structures and cash flow for the next cycle. All told, the Big Three cloud players are on a pace to spend about $240B this calendar year on CAPEX, with AI revenue coming in at about 10% of that figure. We clearly have a big hurdle before that massive investment pays back.
In this Breaking Analysis, we update you on our latest take of the cloud infrastructure market with a fresh look at growth rates in context, market share projections for the year, and the puts and takes for each of the Big Three from their earnings prints. We’ll also share some spending data from ETR and a look at the road ahead.
CY Q2 at a Glance
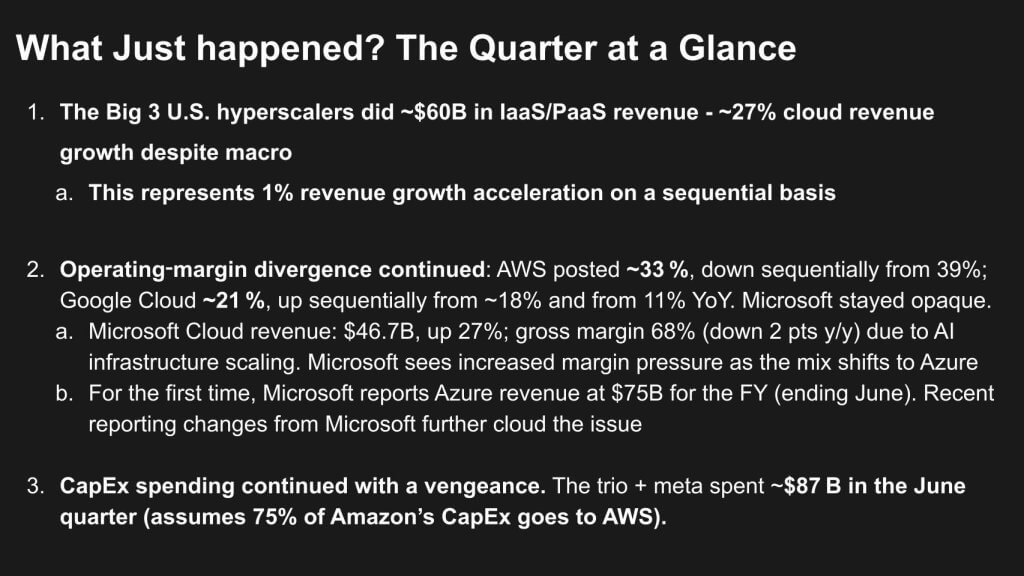
The Big Three U.S. hyperscalers just put up roughly $60B of IaaS/PaaS revenue, and all-in IaaS/PaaS grew about 27% YoY. Importantly, that’s a one-point acceleration sequentially — all while demand is still outrunning supply.
Margins continue to be divergent. AWS came in around 33% operating margin, down from 39% last quarter as depreciation and its seasonal stock-based comp step-up hit — all with continued capacity constraints. Google Cloud, while far less profitable, continues to show material improvement. Operating margin increased to roughly 21%, up from ~18% last quarter and 11% a year ago — showing steady execution. Microsoft is a bit more opaque on its cloud operating margin as Azure drags margins down, but the company gave us some solid hints and a first-time Azure revenue disclosure. Microsoft Cloud revenue was $46.7B, up 27%, with gross margin at 68%, down 2 points as AI infrastructure scales and the mix shifts toward lower-margin Azure. But for the first time, Microsoft put a number on Azure at $75B for the fiscal year — but remember, recent definition changes and the AI inference boost muddy apples-to-apples comparisons and contain a clever communications strategy by Microsoft.
CAPEX is the real story, however. The trio — plus Meta — shelled out about $87B in the June quarter. By our math, ~75% of Amazon’s CAPEX is for AWS, underscoring the supply build-up. The bottom line is that Azure’s AI pop is real (but fattened by ChatGPT inference), AWS is constrained but investing through it, and Google is quietly widening margins while it scales.
Let’s take a look at the key performance indicators and do a quick scan of the metrics that matter:
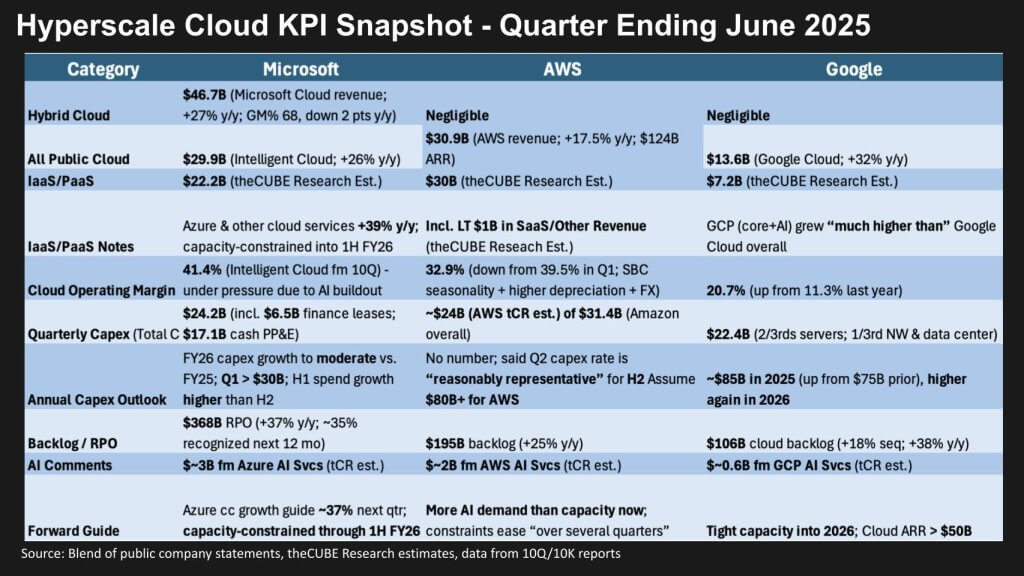
Microsoft: Microsoft Cloud came in at $46.7B for the quarter (+27% y/y) and Intelligent Cloud $29.9B (+26%) with Azure and other cloud +39% y/y (CC); Microsoft didn’t disclose its quarterly Azure performance, but we’ve mapped our models to the $75B figure and estimate Azure IaaS/PaaS at ~$22.2B, with Azure AI services at ~$3B. Management guided that “demand exceeds supply” into 1H FY26 (2H CY 25), with its Q1 FY CAPEX guided to $30B-plus.
AWS: AWS revenue was $30.9B (+17.5% y/y; $124B ARR) with 32.9% operating margin pressured by seasonal SBC and higher depreciation; we peg AI services at around $2B for AWS. Backlog hit $195B, and CAPEX stayed heavy ($24B of Amazon’s $31.4B in Q2 went to AWS by our estimates). Supply constraints continue but are expected to improve over several quarters.
Google Cloud: Google Cloud posted $13.6B (+32% y/y) and 20.7% operating margin; we estimate GCP (IaaS/PaaS) at ~$7.2B, growing “much faster” than Google Cloud overall, with GCP AI services around ~$0.6B. CAPEX was $22.4B in Q2, and the 2025 outlook was raised to ~$85B (higher again in 2026), with backlog at $106B and capacity tight into 2026.
Positives and Negatives for the Big Three
Now let’s look at the pluses and minuses for each player.
Microsoft — quick read
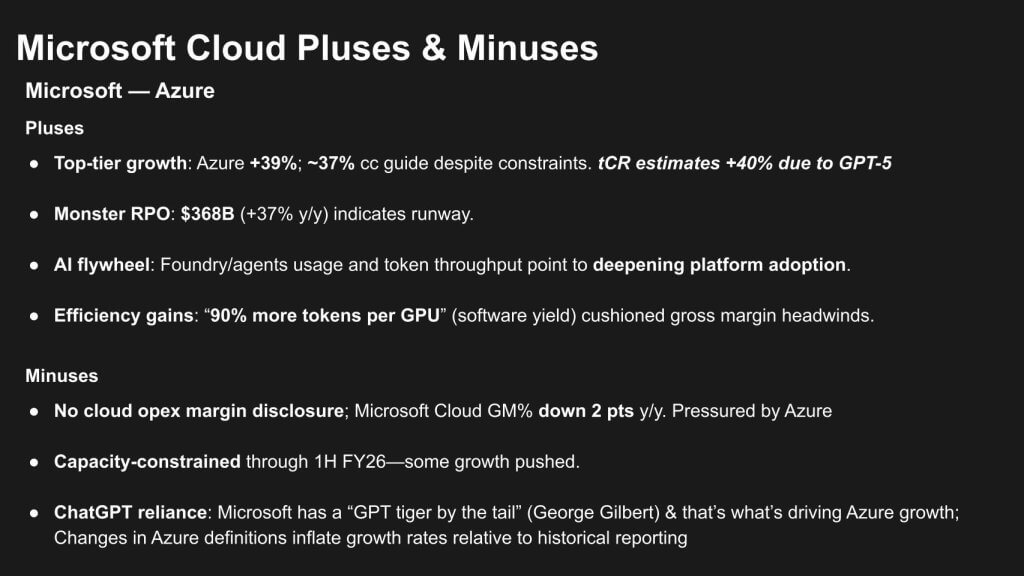
Pluses: Azure is still ripping — ~39% growth with management guiding to ~37% cc next quarter even while capacity-constrained. We think it will be even higher — perhaps as high as 40% with GPT-5. A $368B RPO (+37% y/y) says the company has a long runway, and Foundry/agent adoption combined with surging token throughput says Microsoft has found a true AI platform flywheel. But it appears heavily tied to OpenAI, which is broadening its ecosystem horizontally with new open-source models. Software efficiencies are kicking in with a (“~90% more tokens per GPU” year on year). Without this, the gross-margin drag from scaling AI infrastructure would be much worse.
The other welcome positive is the $75B Azure disclosure.
Minuses: Microsoft still won’t disclose an Azure operating margin and is cagey around cloud operating margin. Overall, Microsoft Cloud gross margin fell ~2 pts y/y, pressured by Azure’s AI mix. Supply remains tight through 1H FY26, implying some demand is being pushed. A significant piece of Azure’s momentum appears tied to ChatGPT inference and to reporting definitional changes, which confuse the growth rate relative to historical reporting.
AWS — quick read
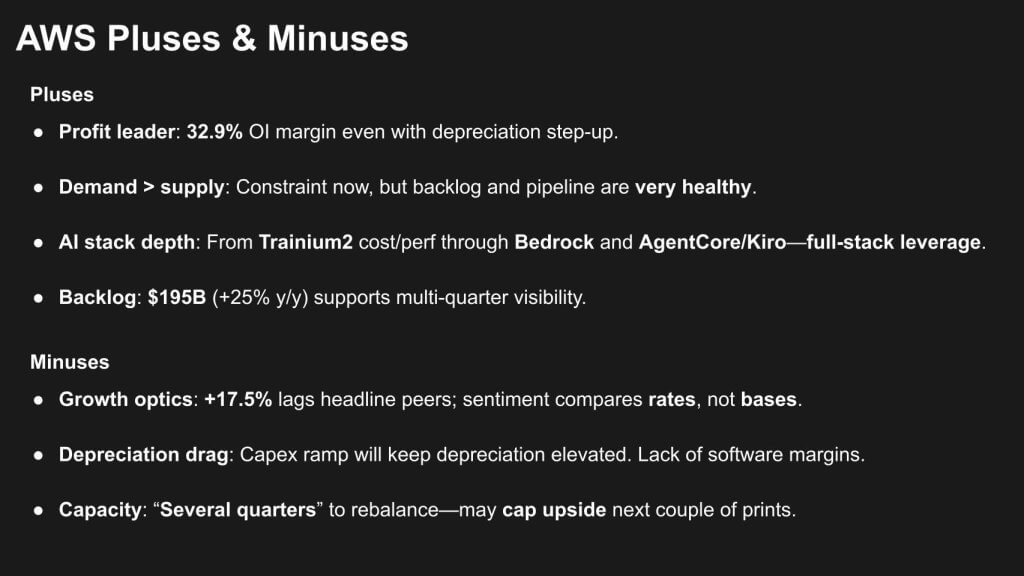
Pluses: Still the revenue leader and despite the drop in operating margin from the high 30s to ~32.9%, AWS remains profitable for what is essentially a company that sells access to hardware resources. Demand exceeds supply; backlog sits at ~$195B (+25% y/y), and the AI stack runs deep and wide — from Trainium2 to Bedrock plus AgentCore/Kiro (announced at NYC Summit) and a vast ecosystem that gives AWS customers choice and the company’s full-stack leverage.
Minuses: Headline growth of ~17.5% trails Azure/GCP and invites lazy comparisons. Let’s face it: AWS is getting out-marketed right now by Microsoft when it comes to cloud momentum. Heavy CAPEX means elevated depreciation, and with capacity expected to rebalance over “several quarters,” near-term upside may be capped.
Google— quick read
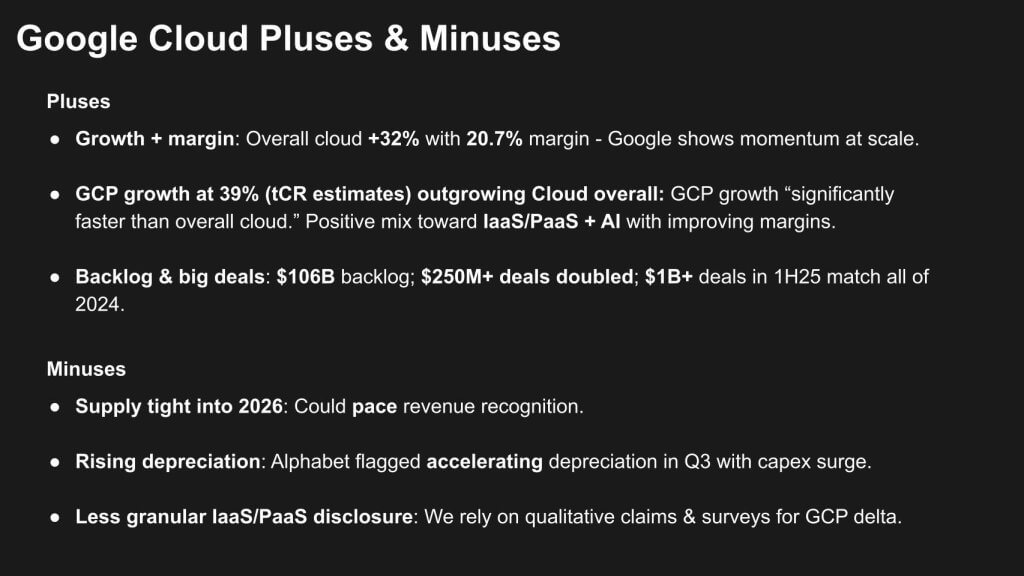
Pluses: Google Cloud is hitting a nice combo of scale and improving profitability — ~32% growth with ~20.7% operating margin — and GCP (IaaS/PaaS + AI) is growing much faster than overall cloud (tCR est. ~39%). Backlog momentum is real at ~$106B, with $250M+ deals doubling and $1B+ wins in 1H25 matching all of 2024.
Minuses: Capacity remains tight into 2026, which could pace revenue recognition, and Alphabet flagged an acceleration in depreciation as CAPEX grows — both potential margin headwinds. Disclosure on pure IaaS/PaaS remains less granular, so we’re relying on qualitative signals and survey data for GCP’s exact mix shift.
The Scoreboard on IaaS / PaaS Revenue and Market Share
Let’s zoom out and take a look at the annual revenue and market share forecasts:
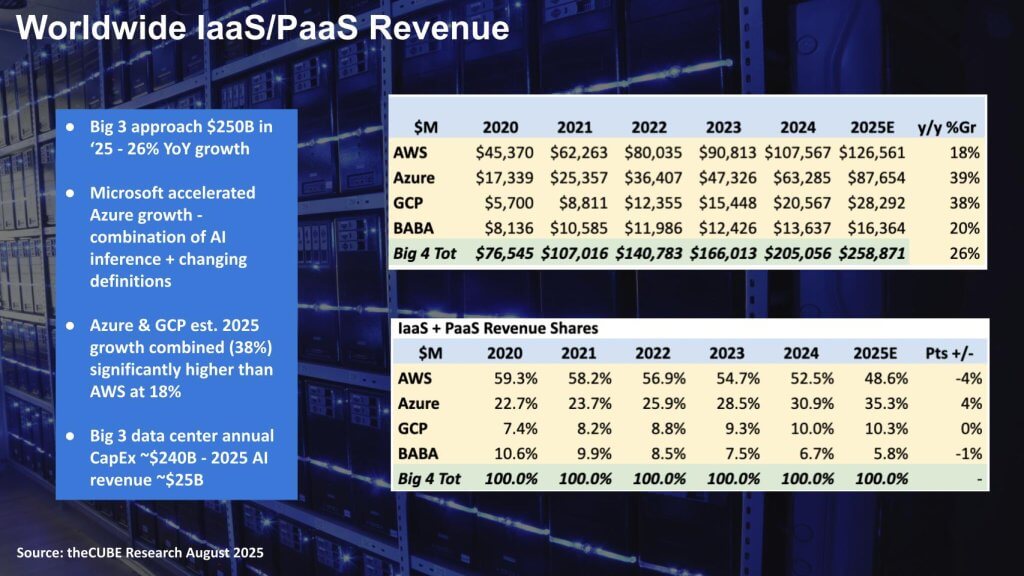
Cloud infrastructure is now a quarter-trillion-dollar market. In 2025, the Big Three plus Alibaba will clear about $259B in IaaS/PaaS revenue, up roughly 26% year over year. AWS remains the revenue leader at ~$126.6B, but its growth cadence — ~18% — is well below Microsoft Azure and Google Cloud Platform, both running high-30s. Azure is the big story: ~$87.7B in 2025E IaaS/PaaS, with growth juiced by AI inference volumes and Microsoft’s shifts in what it counts as ‘Azure.’ GCP is a solid #3 at ~$28.3B, growing about as fast as Azure from a smaller base.
Share shifts continue. AWS drops about four points of IaaS/PaaS share since 2024 to ~48.6%. Microsoft picks up ~4 points to ~35.3%, while Google holds steady around ~10%. Put differently: Azure + GCP are growing at a combined ~38% versus AWS at ~18%. That gap continues to attract negative attention to AWS.
Underneath the revenue lines is an unprecedented CAPEX cycle. The Big Three are on pace to pour roughly $240B a year into data centers, power, and servers to feed AI demand. Yet 2025 AI services revenue is only on the order of ~$25B from these three, which means heavy front-loading, i.e., lots of spend now for monetization that (hopefully) scales later. The bottom line is AWS still throws off the most dollars, but Microsoft’s definition-plus-AI strategy is gaining share fast, and Google is quietly compounding with evidence of improved profitability and a long runway.
Microsoft’s Clever Shell Game
Let’s look at the nuances of interpreting the growth rates and the games vendors play with numbers.
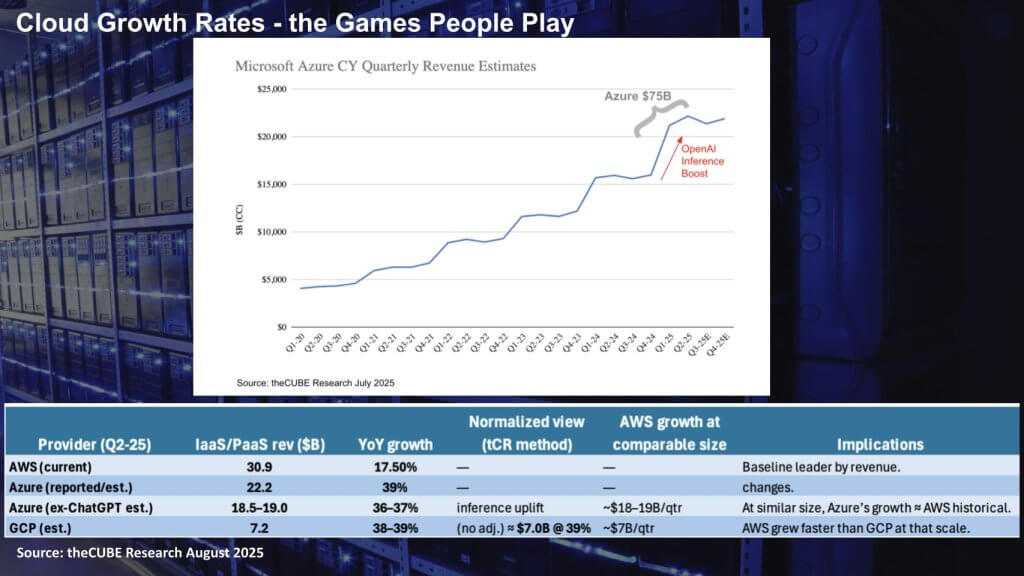
The Azure revenue trajectory has been quite remarkable, as shown in the chart above. Entering COVID, we estimate that Microsoft Azure was generating roughly $4 billion per quarter. Today, our estimates indicate that Azure is running at more than $21 billion per quarter, growing in the high 30% range. Note that the revenue flattening in 2024 roughly coincides with the removal of the Enterprise Mobility, Security and Power BI per-user pricing revenue within Azure definitions. It replaced those low-growth businesses with smaller but faster-growing AI. As such, you see the Azure curve steeply rises into 2025 as Azure AI services kick in. The timing was right, and Microsoft discloses that Azure has surpassed $75 billion.
[See our detailed analysis of the Azure financial disclosures and the definitional changes.]
Microsoft’s FY 2025 ends in CY Q2 2025, and the $75 billion figure corresponds to the CY periods comprising Q3 2024 through Q2 2025. In our view, Microsoft cleverly timed its reclassification of Azure revenue and the $75 billion disclosure to underscore its substantial revenue base and its significantly higher growth rate relative to AWS.
But this is the ‘growth optics’ slide — i.e., the games people play.
The bottom half of the above chart tries to put everyone on the same field. AWS did ~$30.9B IaaS/PaaS in the quarter, up 17.5%. Mapping to the $75B figure, we have Microsoft at ~$22.2B, +39%. If you normalize for the ChatGPT uplift and Microsoft’s definitional tweaks, our range for ‘core Azure’ is ~$18.5–$19.0B growing in the mid-30s; or, by its previous definitions, 20%. At that size, AWS also historically grew in the mid-30s, so the meme that ‘AWS is lagging’ is mostly rate-of-change noise. Google Cloud Platform is ~$7.2B, growing ~38–39%. Strong, but when AWS was at ~$7B, it was growing at ~45%, so this isn’t unprecedented hypergrowth.
Net Net: The market is ripping, but a lot of Azure’s pop is AI inference optics. George Gilbert points out that Microsoft doesn’t want to highlight the fact that it has a ChatGPT tiger by the tail. Probably 50% of OpenAI’s revenue goes to COGs – i.e., Azure fees. The point is, strip that out and the growth curves of AWS and Azure converge when normalizing for size of business over time. Nonetheless, AWS remains the dollar leader, Azure is gaining share with these AI / OpenAI tailwinds, and GCP is executing cleanly off a smaller base.
ETR Spending Data Confirms the Velocity Macro
Let’s look at some of the spending data from ETR on the big 3 cloud players.
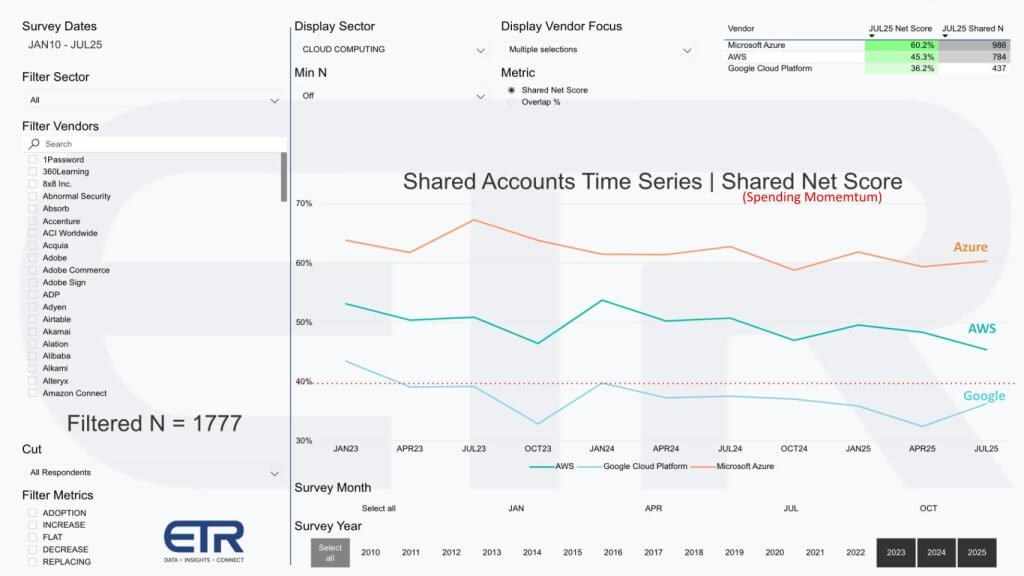
ETR’s Shared-Net Score data shows spending momentum still favoring Azure. Remember this is account-based, not revenue-based. In July ’25, Azure posts a 60.2% Shared Net Score on 986 accounts, well ahead of AWS at 45.3% (N=784) and GCP at 36.2% (N=437) out of 1,777 total shared responses. The 40% dotted line indicates highly elevated spending velocity, so despite AWS’s lower score, it’s still elevated. Over the last 18 months, Azure has held a persistent 60%+ Net Score, consistent with AI-driven expansions and Microsoft’s bundle leverage. AWS softened in late ’23, then recovered into the mid-40s — steady but still capacity-limited. GCP’s momentum cooled through ’24 into mid-’25, now mid-30s, possibly reflecting bigger, longer deal cycles rather than broad-based expansions. The net is that in overlapping accounts, account-share momentum = Azure > AWS > GCP.
Market Penetration Shows a Possible Shift in Priorities
Here’s a similar slide but it shows the penetration into the data set.
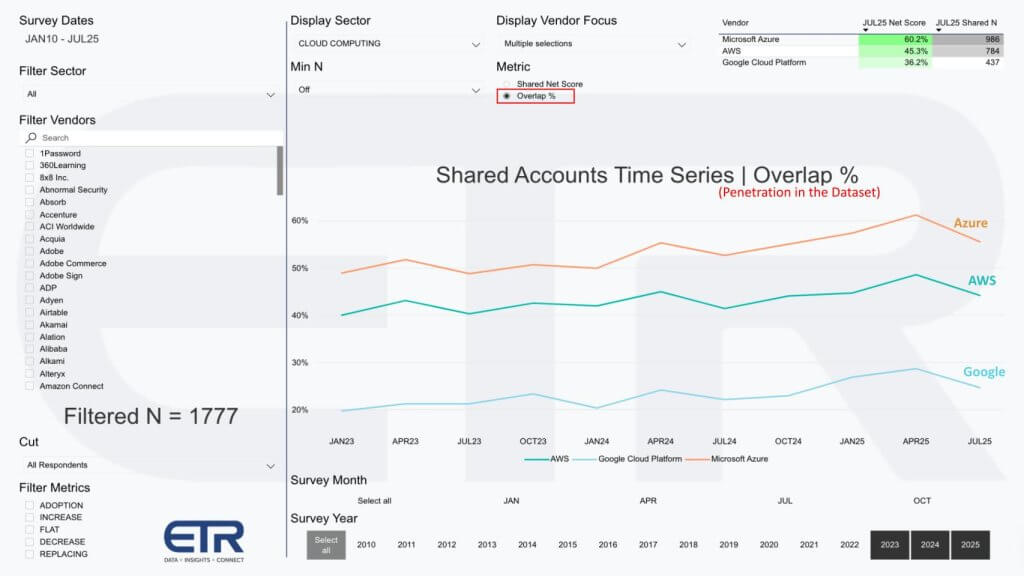
Surprisingly, all three are showing deceleration in the pervasiveness metric. This doesn’t fly in the face of the rapid and accelerating cloud growth rates. However, what it speaks to is that spending is shifting to other categories, namely AI, and possibly some pause in AI experimentation on the cloud and some thought of moving toward on-prem — or balancing in that direction. Again, this data doesn’t represent spending levels; rather, it represents account penetration. Microsoft is ubiquitous and speaks to why Azure’s penetration is so high. AWS continues to broaden its footprint with shared-account penetration. GCP is still the third player and quite a distance from the leaders.
Looking to 2H 2025 and into 2026
Let’s close with a look at things to watch going forward.
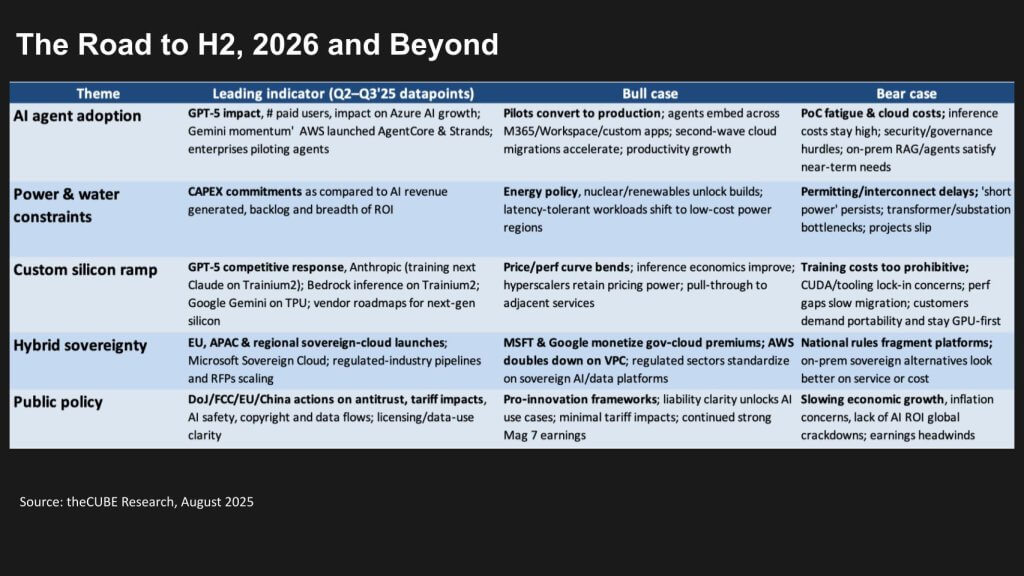
Here’s the bottom line heading into H2 and the 2026 window on the Bull and Bear cases: We’re tracking three swing factors that will decide the leaderboard — agent adoption, power, and silicon. If pilots flip to production and enterprise agents get embedded across Microsoft M365, Google Workspace and custom apps, we may get a second wave of cloud migration and real productivity gains. For AWS, which lacks a ubiquitous collaboration software platform, it must rely primarily on its builders. Offerings around Q Developer are critical for developers to create software and apps on the AWS platform. But if customers don’t see broad based ROI and they suffer from PoC fatigue, things could slow. Of course, we’re always watching the macro spending picture as well, which right now is cautious outside of AI.
We’re also looking at the pace of CAPEX buildouts and permitting. If regulations keep dragging and “short on power” becomes the norm, growth gets slowed by lack of kilowatts, not underlying demand.
For silicon designers like these three: If price/performance keeps improving not only with Blackwell GPUs, but in-house silicon like Trainium and TPUs, along with better inference economics, hyperscalers can keep pricing power, and this will pull adjacent services. If GPUs remain constrained or customers are concerned about CUDA lock-in and high training costs, that could be a headwind, and the bear case is that migrations slow and customers may pull back a bit.
Sovereign-cloud is a monetization tailwind. Microsoft has the strongest hybrid story of the Big Three with its legacy on-prem Azure stack footprint, and there’s evidence that its non-cloud business remains strong. Google is probably even more incentivized to partner for on-prem deployments while AWS doubles down on VPC-native sovereignty and has Outposts in its back pocket. Policy is the wild card; a pro-innovation framework with licensing/data-use clarity supports spending, while broad antitrust/tariff shocks or an AI-ROI vacuum will cause buyers to tap the brakes.
Our base case is that pilots begin converting, power eases gradually, custom silicon improves inference unit economics, and sovereignty continues to be in demand. But the big concern is that enterprises continue to struggle with good data. Bad data will constrict AI payback and agentic adoption. All that said, CAPEX continues to be the mainspring of AI enthusiasm, and the Azure playbook is popping. AWS is not standing still, and Google’s quiet execution is showing improved mix and margin, which is encouraging.
Watch these signs: Agent adoption, weekly active users, and token volumes. In addition, pay attention to CAPEX versus AI revenue realization, the share of inference on non-GPU silicon, sovereign-cloud RFP velocity, and any shift in liability rules.
If the players hit on these, the cloud up-cycle runs right through 2026. This is our expectation. This is our base case.
What’s yours? Please get in touch and let us know.