Despite a mixed bag of earnings reports from tech companies, negative GDP growth this past quarter and rising inflation…the cloud continues its relentless expansion on the IT landscape. AWS, Microsoft and Alphabet have all reported earnings and, when you include Alibaba’s cloud in the mix, the big 4 hyperscalers are on track to generate $167B in revenue this year based on our projections. But as we’ve said many times the definition of cloud is expanding. And hybrid environments are becoming the norm at major organizations. We’re seeing the largest enterprise tech companies focus on solving for hybrid and every public cloud company now has a strategy to bring their environments closer to where customers’ workloads live – in data centers and the edge.
Hello and welcome to this week’s Wikibon CUBE Insights, Powered by ETR. In this Breaking Analysis we’ll update you on our latest cloud projections and outlook. We’ll share the latest ETR data and some commentary on what’s happening in the “hybrid zone” of cloud.
Big 4 Hyperscale IaaS & PaaS Performance
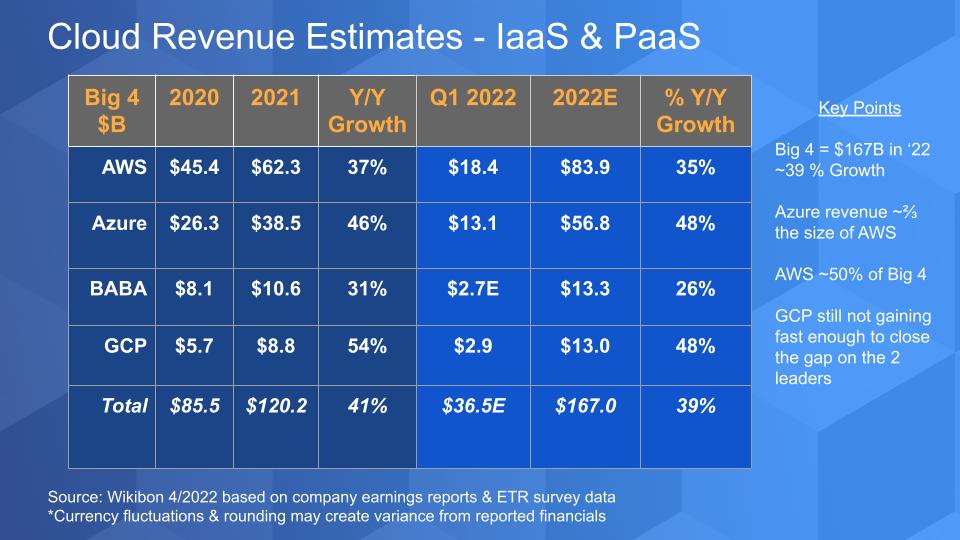
In the chart above we share our big 4 cloud shares for IaaS & PaaS for 2020, 2021, Q1 ‘22 and our estimate for full year 2022 and relative growth. Remember, only AWS and Alibaba report relatively clean IaaS and PaaS figures whereas Microsoft and Google bundle their cloud infrastructure in with their SaaS numbers. Both firms however give guidance and we use survey data and other tidbits to create an apples-to-apples comparison.
For the quarter the big 4 approached $37B in revenue as a group. Azure’s growth rate is reported by Microsoft, but the absolute revenue number is not. Azure growth accelerated sequentially by 49% to just over $13B in the quarter by our estimates; while AWS’ growth moderated sequentially but revenue still hit $18.4B. Azure is more than 2/3rds the size of AWS’ cloud business. Google and Alibaba are fighting for the bronze medal but well behind the two leaders. Microsoft’s Azure acceleration is quite remarkable for such a large revenue base, but it’s not unprecedented as we’ve seen this pattern before with AWS. Nonetheless, the fact that Azure is growing at the same rate as GCP is quite impressive.
A couple other tidbits. Amazon stock got hammered the day after it announced earnings because of inflation and slowing growth rates. But AWS continues to beat Wall Street’s expectations. A look at Amazon’s operating income this quarter tells the story. Amazon overall had operating income of negative $3.66B. AWS’ operating income was $6.52B. AWS’ operating margin grew sequentially from nearly 30% to 35.3% – an astoundingly profitable figure. This is comparable to highly profitable companies like Oracle and Microsoft. Software companies with software marginal economics. Is that level sustainable? Probably not but it’s eye-opening nonetheless.
Breaking Down the Spending Patterns on the Big 4
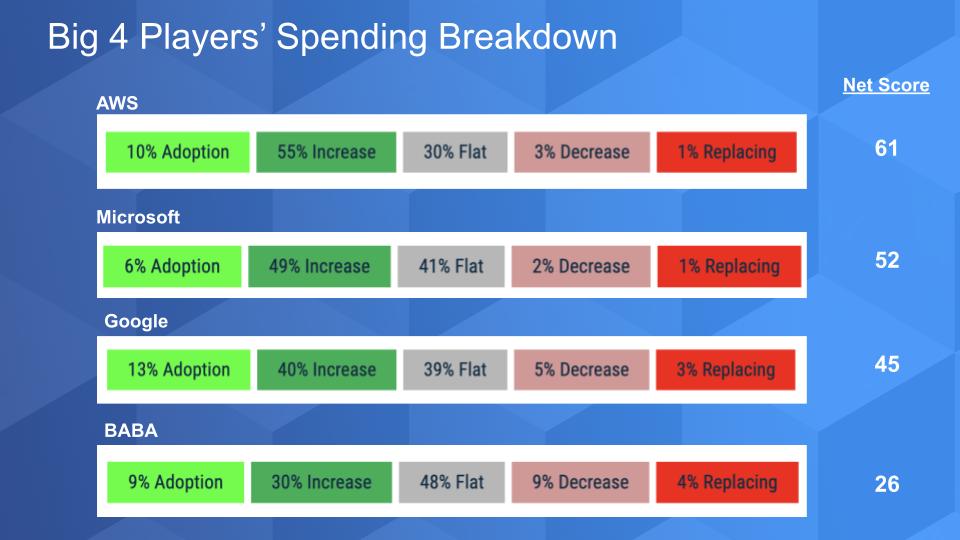
The chart above shows the Net Score granularity for the big 4 cloud players. Net Score measures spending momentum by asking customers are you adopting new – that’s the lime green; increasing spend by 6% or more – that’s the forest green; flat spend is the gray; spend dropping by 6% or worse – that’s the light pink; and the red is decommissioning the platform. Subtract the reds from the greens and you get a Net Score shown on the right. Anything over 40% is highly elevated.
The key points here are as follows: The Microsoft data above includes the company’s entire business – not just cloud. Its Azure-only Net Score is 67…higher than even AWS’. That’s huge. Google Cloud on the other hand, while still elevated, is well behind the two leaders. Alibaba’s data sample in the ETR survey is small and China has had its foot on the neck of big tech for a while so we can’t read too much into a Net Score of 26.
But notice the replacements in red – single digits for all and low single digits for the two giants – 1% – very impressive.
CAPEX Spending Tells the Story
CAPEX spend tends to be a pretty good indicator of scale. Charles Fitzgerald who runs the Plaformonomics blog spends a lot of time on this topic and we borrowed the chart below from a recent post – and added some estimates of our own.
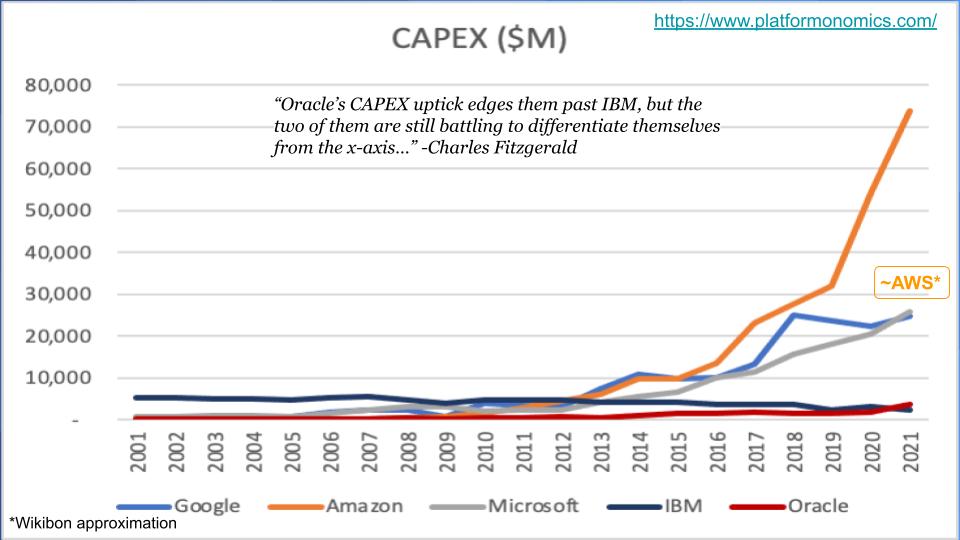
It shows CAPEX spend over time for five cloud companies – the big 3 U.S. firms plus IBM and Oracle. It’s always astounding to go back to the pre-cloud era and look at IBM. The company was in a great position to dominate the transition to as-a-service but couldn’t get its head around cloud and out of its professional services and outsourcing businesses. IBM is that dark blue or black line. It was outspending Amazon in CAPEX well into the last decade. Same with R&D spend by the way.
Charles is a bit of a snark – he loves to make fun of our Supercloud concept even though we’re confident it’s evolving and is real. But his point above is right on. The big 3 U.S. players spend far more on CAPEX than IBM and Oracle. He jokes that Oracle’s uptick in CAPEX spend puts them past IBM but the two of them are battling to distance themselves from the X-axis. Funny guy.
In its recent earnings report, Amazon stated that around 40% of its CAPEX goes to infrastructure and most of that to AWS. It expects CAPEX to grow this year and around 50% will go toward infrastructure so we’ve superimposed our estimate of where AWS lands.
Once again Microsoft is notable because unlike Amazon, it doesn’t have a zillion warehouses to ship products to consumers. And while Google’s spending is massive – it’s mostly on servers to power its ad network. Of course, GCP can leverage that infrastructure and the tech behind it. And it does.
And so can everyone else leverage all this CAPEX spend…We’ll come back to that and talk about supercloud in a moment.
The Ever-expanding Cloud Landscape
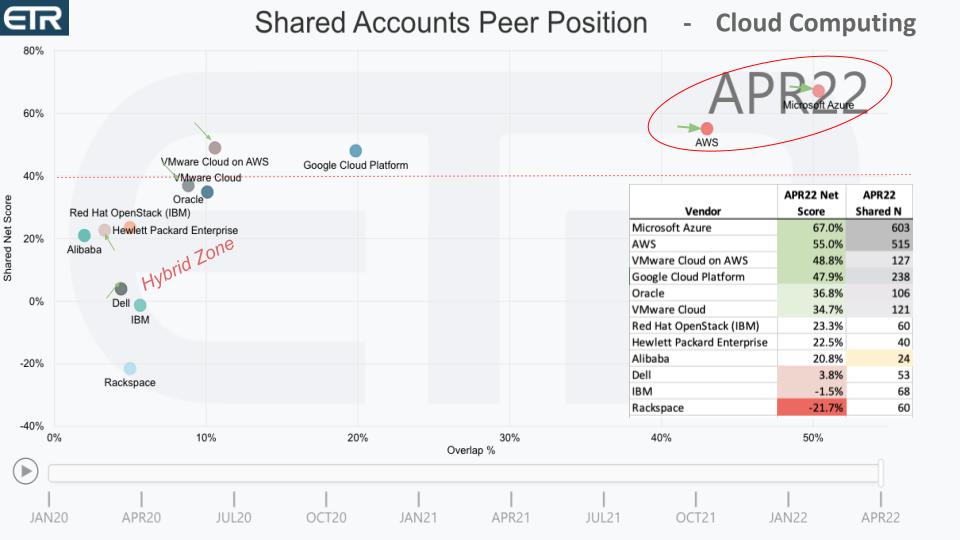
The chart above shows a two dimensional view of the ETR data for cloud computing. On the vertical axis is Net Score or Spending momentum and on the horizontal axis is pervasiveness in the data set. The X-axis is like market share within the survey if you will. The table insert shows the data for how the dots for each vendor are plotted on each axis.
The red dotted line at 40% indicates a highly elevated position. And the green arrows show the movement for some companies relative to three months ago
Microsoft and AWS are circled in red way up in the right hand corner. Very impressive. Just to reduce clutter, we’re not showing AWS Lambda and some other highly elevated services which would push up AWS’ Net Score…but it’s still really really good…as is Azure’s. They’re both moving solidly to the right relative to last quarter’s survey.
Google is well behind and has much work to do. It was announced this past week that the head of sales at Google Cloud, Rob Enslin is leaving to join UiPath…some interesting news there.
We’ve highlighted the “Hybrid Zone.” Now to the theme of this Breaking Analysis – the ever-expanding cloud. AWS announced that it’s completed the launch of 16 local zones in the U.S. and there are 32 more coming across 26 countries. Local Zones basically bring cloud infrastructure to regions where there’s a lot of IT that isn’t going to move. And for proximity and latency reasons they have to move closer to the customers. There’s that CAPEX buildout coming into play again.
Now the reason this hybrid zone becomes interesting is you’re seeing the large enterprise players finally going after the hybrid cloud in earnest. It’s almost like the AWS Outposts announcement in 2018 was a wake up call to traditional infrastructure players like Dell, HPE and IBM. Oracle is kind of skipping to its own tune but they’re in that hybrid zone too. IBM had a good quarter and the Red Hat acquisition seems to be working to support its hybrid cloud strategy. VMware several years ago cleaned up its fuzzy cloud strategy and partnered up with everyone. And you see above, VMware Cloud on AWS doing well as is VMware Cloud – its on-prem offering. Even though it’s somewhat lower on the X-axis relative to last quarter it’s moving to the right with a greater presence in the data set.
Dell and HPE are also interesting. Both companies are going hard after as-a-service with APEX and GreenLake respectively. HPE, based on the survey data from ETR, seems to have a lead in spending momentum, while Dell has a larger presence in the survey as a much bigger company. HPE is climbing up on the X-axis as is Dell, although not as quickly.
And the point we come back to often is the definition of cloud is in the eye of the customer. AWS can say “that’s not cloud.” And the on-prem crowd can say “we have cloud too!” It really doesn’t matter. What matters is what the customer thinks and in which platforms they choose to invest.
That’s why we keep circling back to the idea of supercloud. You are seeing it evolve and you’re going to hear more and more about it. Maybe not the term – many don’t like it – but we’ll continue to use it as a metaphor for a layer that leverages the CAPEX gift the big hyperscalers are providing the industry. This is a real opportunity for the likes of Dell, HPE, IBM, Cisco and dozens of other companies providing compute and storage infrastructure, networking, security, database and other parts of the stack. It’s different to us than multi-cloud, which is really multi-vendor– i.e. my stack runs on clouds 1, 2 & 3 as a bespoke service.
The opportunity in our view is to hide the underlying complexity of the cloud, dealing with all the API and primitive muck, creating a singular experience across on-prem, across all the clouds and out to the edge. We see this as a new battle shaping up and new opportunities for startups to facilitate. It will be expensive to build and will require ecosystem cooperation across the API economy to make it a reality. There’s a definite customer need for this common experience and in our view we’re seeing it manifest in pockets today and in R&D projects within both startups and established players.
In our view, it’s the future of cloud for any company that can’t spend $30B a year on CAPEX…
Keep in Touch
Thanks to Stephanie Chan who researches topics for this Breaking Analysis. Alex Myerson is on production, the podcasts and media workflows. Special thanks to Kristen Martin and Cheryl Knight who help us keep our community informed and get the word out. And to Rob Hof, our EiC at SiliconANGLE.
Remember we publish each week on Wikibon and SiliconANGLE. These episodes are all available as podcasts wherever you listen.
Email david.vellante@siliconangle.com | DM @dvellante on Twitter | Comment on our LinkedIn posts.
Also, check out this ETR Tutorial we created, which explains the spending methodology in more detail.
Watch the full video analysis:
Note: ETR is a separate company from Wikibon and SiliconANGLE. If you would like to cite or republish any of the company’s data, or inquire about its services, please contact ETR at legal@etr.ai.
All statements made regarding companies or securities are strictly beliefs, points of view and opinions held by SiliconANGLE media, Enterprise Technology Research, other guests on theCUBE and guest writers. Such statements are not recommendations by these individuals to buy, sell or hold any security. The content presented does not constitute investment advice and should not be used as the basis for any investment decision. You and only you are responsible for your investment decisions.