The investor community is realizing that the return on invested capital for the AI buildout is going to take some time. The payback period for enterprise AI investments is not akin to the dopamine rush from completing a great workout. This realization combined with several other macro factors, has caused the big AI names to pullback hard recently. But the big Internet giants remain unfazed and seem to believe that the risk of missing out on the AI boom are greater than over rotating on the opportunity. As such the CAPEX outlays related to AI, including buying land, building out data centers and procuring GPUs, continue to escalate.
On the demand side of the equation, enterprises are not so aggressive. While AI experimentation is ongoing, the results, although promising, are not yet meaningful to income statements. Layoffs remain noticeable, AI initiatives are squeezing other projects and CFOs are cautious. Markets seem confused and volatility is up. We’ve seen this dynamic in previous waves where end market demand for the next big thing, isn’t yet large enough to offset the softness in existing lines of business. More turbulence and uncertainty is likely until, as we’ve said numerous times, AI throws off enough cash to be self-funding.
In this Breaking Analysis, we check in on the latest industry and ETR data to try and bring some clarity to what’s happening in the markets. We’ll also share our most current data on hyperscale market shares.
Global Markets Trigger Panic…Investors Sell AI & Crypto
The Bank of Japan made a surprise move by hiking its benchmark rate. Longstanding low rates in Japan have supported the so-called “carry trade,” which is the practice of borrowing cheaper yen to invest in higher yielding assets. This triggered a 12% drop in the Nikkei, bringing back memories of Black Monday from 1987. Combined with Warren Buffett selling a big chunk of his Apple holdings, renewed recession fears and rumors of Blackwell delays and middle east tensions…investors – or maybe algos – decided to lock in profits from inflated AI stocks and BTC.
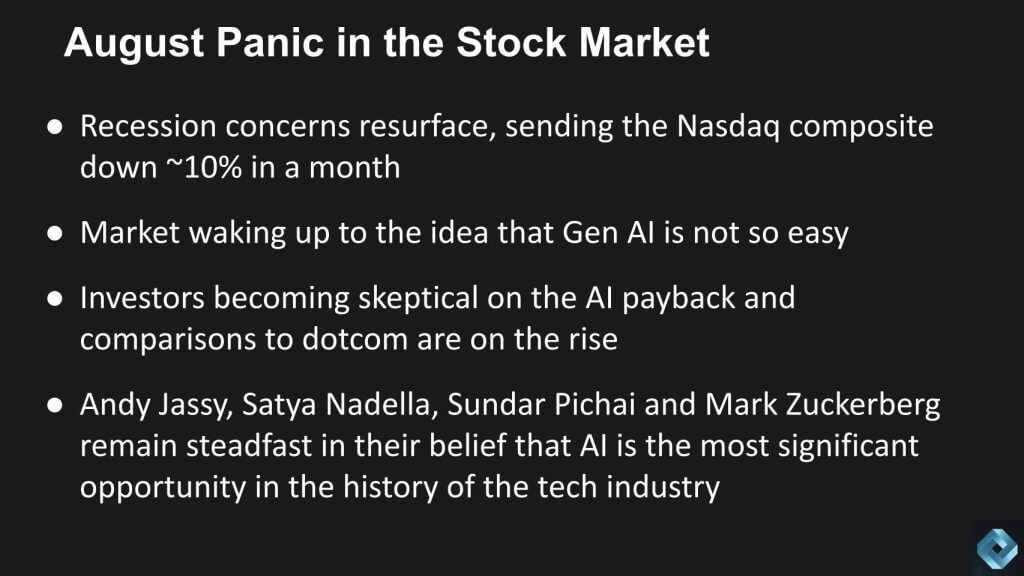
The Nasdaq dipped nearly 15% off its July highs as the world began to realize that Gen AI will take some time to pay off. Fear of a dotcom repeat didn’t help. But Jassy, Nadella, Pichai and Zuck aren’t flinching. They still firmly believe in the AI wave. They have the cash and resources to lead the charge and they’re not taking their feet off the gas pedal.
2024 CAPEX Spend Approaches Hyperscale Revenue
If there’s any question that the CEOs of Alphabet, Amazon, Microsoft and Meta are all in, you simply have to assess their respective CAPEX spend.
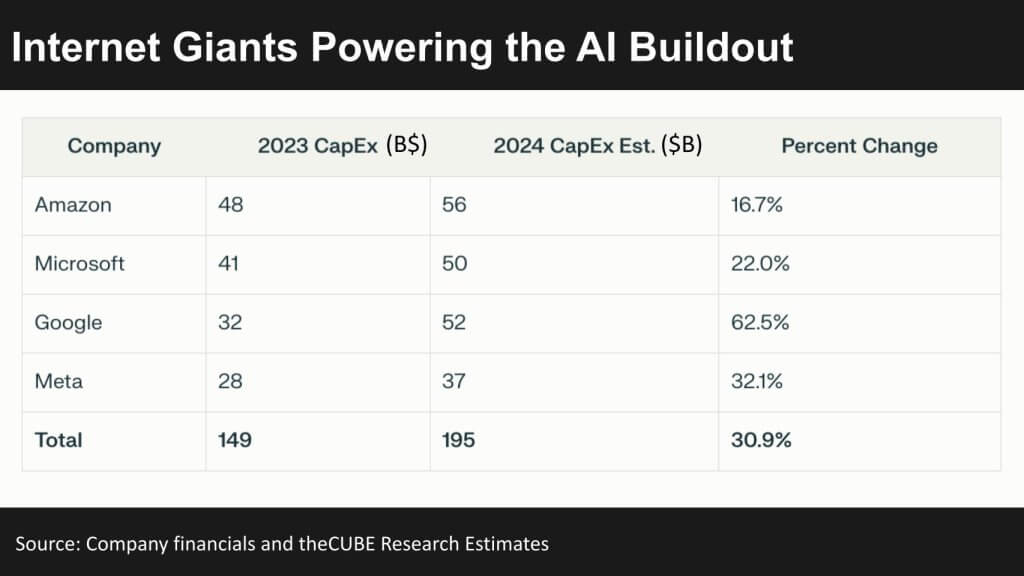
Here are the approximate figures for CAPEX for those four companies for 2023 and 2024. Combined they’ll approach $200B this year. Now granted, some of that spend is not AI or data center related, but most of it is going to acquire land, build data centers and get their hands on GPUs. As we’ll show later, the revenue generated by the hyperscalers is forecast by theCUBE Research to be just over $200B this year. Compared to $195B spent by these four players.
In regards to the dotcom comparisons, while many similarities exist, the buildout in that era had some pretty shaky companies funding the capital expenditures. Enron collapsed due to accounting fraud, WorldCom, Global Crossing and NorthPoint all went bankrupt as well. So did Pets.com, which became the poster child for crappy business models in that era.
Now we are seeing some cracks in the AI armor. For example, the Inflection AI deal with Microsoft where the latter is picking up employees from the former and doing licensing deals to skirt M&A friction. And there are other examples so we’ll see if this blows up but we think the foundation is much more stables in this wave due to the strong balance sheets of cloud players and more disciplined managements.
One other thought on AI ROI. Meta has shown some real promise and didn’t get punished for spending so much on CAPEX and not getting a return. And we believe the reason is they are getting faster ROI because that is the nature of consumer. In consumer, the bigger the GPU cluster the better ad targeting and because of their scale, they are seeing some strong returns from AI.
Customers are not as Aggressive
Customers on the other hand are not as eager to open the check books.
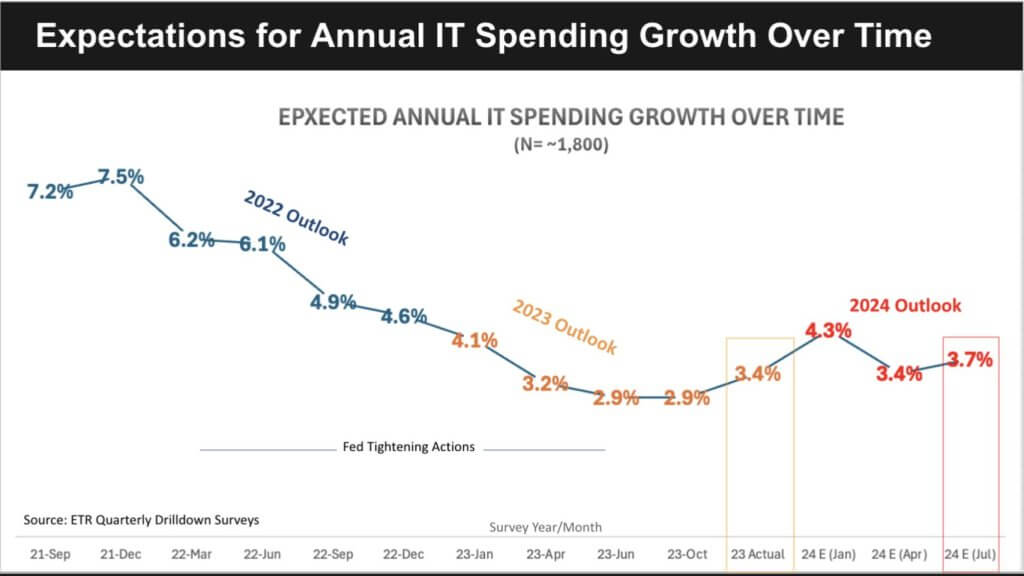
The graphic above from ETR shows the annual tech spending growth expectations from more than 1,700 IT decision makers, or ITDMs, at different points in time. We exited 2023 with ITDMs expecting 4.3% growth. That level moderated in the Q2 survey to 3.4% and in the July survey came in at 3.7% but spending acceleration continues to be weighted toward Q4, causing us to remain cautious despite the uptick.
AI Continues to Dominate the Spending Momentum
The chart below shows the distribution of responses from the same 1,700+ ITDMs in the latest spending survey.
The data on the vertical axis represents Net Score or spending momentum and the horizontal axis shows pervasion of a sector in the data set, which is a proxy for relative account penetration within each sector. The red line at 40% indicates a highly elevated spending level.
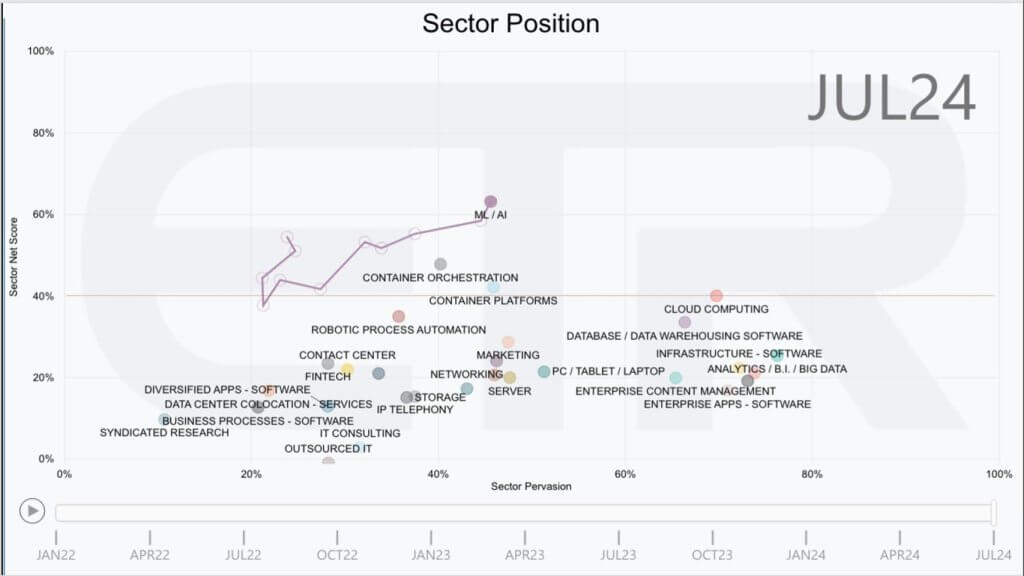
Data from previous surveys prior to the introduction of ChatGPT show that spending velocity in cloud, RPA and container sectors were all above the 40% mark and in comparable positions on the vertical axis.
Cloud Optimization Continues to Wane as AI Demand Soars
Despite the fact that AI is dominating the conversation and often siphoning funds from other projects, the hyperscalers are seeing strong momentum. While Microsoft’s Azure business came in below the high end of estimates, including ours, it still grew 30% year over year. Google cloud performed well and AWS saw accelerated growth. Before we dig into the specific revenue data, let’s take a look at the spending profiles of the big three US hyperscalers.
Below we show data from ETR’s latest survey for Amazon, Microsoft Azure and Google Cloud. We also show additional data including several companies with high on-premises exposure as a point of comparison.
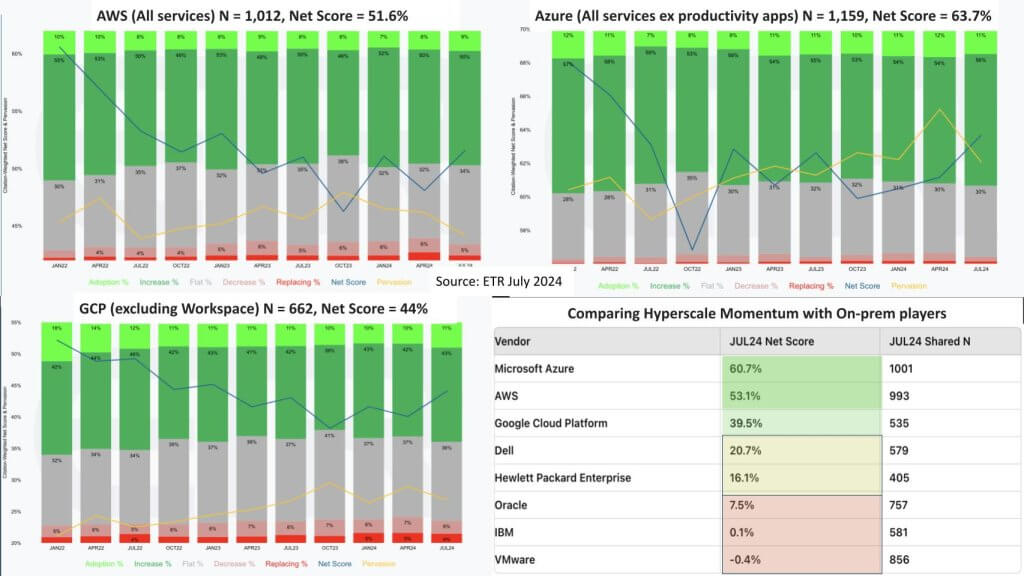
Focus for a moment on the colored bar charts. Starting in the upper left with AWS we show the Net Score granularity from ETRs July survey. Net Score measure spending momentum based on the percent of customers spending a certain way. In the case of AWS, we’re sampling 1,012 AWS customers. The lime green represents the percent of those 1,012 that are new customers to AWS. The forest green shows the percent spending 6% or more. The gray is plus or minus 5%. The pink is spending 6% or worse and the red is the percent churning. Subtract the red from the green and you get Net Score, which for AWS is 51.6% and shown with that blue line. Remember anything over 40% is considered highly elevated.
The yellow is penetration in the survey but let’s not focus on that for now.
To the right of AWS we show Azure at a Net Score of 63.7%. On the bottom left is Google Cloud with a 44% Net Score. Note that all three US hyperscalers are seeing an uptrend in momentum within the survey.
On the bottom right we show the July data for these three plus some proxies for vendors with on-premises exposure. We show both Net Score and the Ns, which indicate penetration into the data set. Larger is more prominent. Notice the three hyperscalers are all at or above the 40% mark. We chose a bit different cut so they won’t match the bar charts exactly but the point is their momentum is substantially above the bellwethers of Dell, HPE, Oracle, IBM and of course, VMware is in a major transition.
Remember, the Net Score methodology is based on customer counts, not revenue and because Broadcom’s strategy is to narrow the account base they will naturally see contraction in the survey from a Net Score perspective. But their N is substantial. What’s happening is fewer customers will be spending more on VMware. A larger percentage will be spending flat or down. As such its Net Score decelerates.
The point is despite talk of repatriation or even AI on-prem, most of the AI work is still being done today in the cloud. While Dell, HPE and Supermicro still have strong demand for AI servers, much of that is going to service providers, at least for now.
Big Four IaaS/PaaS Revenue to Surpass $200B in 2024
We continue to refine our models for hyperscale revenue with a focus on trying to achieve an apples-to-apples comparison across vendors. Below we show our updated annual figures for 2023 and our 2024 estimates.
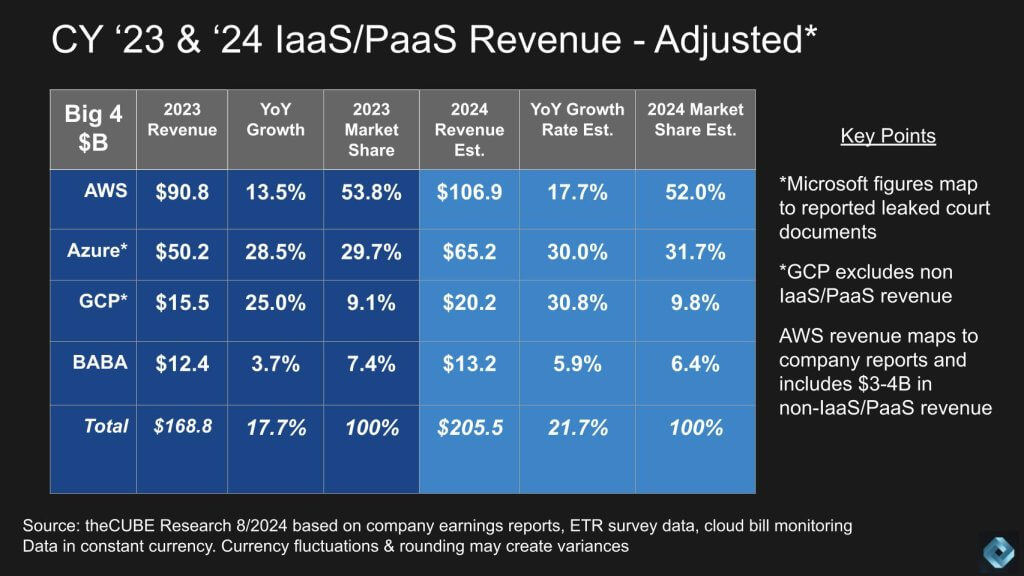
Some key points of clarification relative to definitions and methodology.
- We anchor our IaaS and PaaS data for Microsoft Azure on the leaked court documents from the Activision trial. We do so to try and make a unified comparison across all three cloud vendors.
- As such our estimates are lower for Azure than many other firms, which don’t attempt to reconcile to those leaked documents.
- We also adjust our GCP figures to attempt to exclude SaaS from Google’s numbers. We have made estimates for each company across IaaS, PaaS, SaaS and Services at a more granular level and can make that data available upon request.
- Note that these figures map to Amazon’s public statements and overstate AWS’ figures by roughly $3-4B because they include a small amount of SaaS (e.g. Chime and Q); and some professional services. Over time we will report those out but in the interest of time we’ve maintained our historical models for this episode
As it relates to the market, the following key points are noteworthy:
- The market for these four players will surpass $200B this year.
- Growth is accelerating and will approach 22% relative to 2023.
- Cloud optimization is still in play but at much lower levels than in 2022.
- Amazon maintains revenue share above 50% based on our methodology of mapping to leaked court documents for Azure.
Cloud continues to outpace on-premises growth by a wide margin. Most legacy players are growing in the low to mid single digits or in some cases contracting, while the cloud growth of 20%+ on a base of $168B is accelerating.
We continue to dig deeper into these figures and will share more granular data going forward.
Squinting Through the Uncertainty
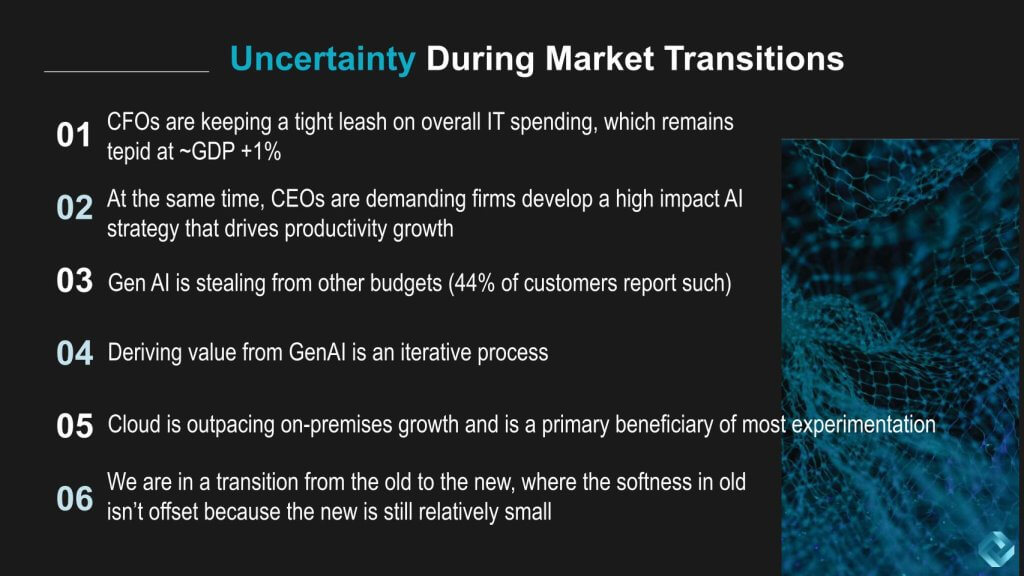
Here are some final thoughts we’ll leave you with today.
In our assessment, it’s evident that CFOs are maintaining a conservative approach to IT spending, with relatively tepid IT growth coming in just above GDP. Despite this, CEOs are putting pressure on their teams to develop high impact AI strategies that can significantly enhance productivity. Generative AI is notably reshaping budget allocations, with 44% of customers indicating that these initiatives are cannibalizing other areas of investment.
The path to realizing tangible value from GenAI remains an iterative process that can get quick wins but larger returns are proving to take more time. In particular, organizations start experimenting to gain experience, they must prioritize use cases, test viability of initiatives on the short list, improve data quality in those areas, constantly test different LLM models, try different techniques to improve results, manage security, privacy, compliance and governance along the way and keep iterating. This elongates the payback period and, thus far, Gen AI ROI is uninspiring in the enterprise.
The cloud sector continues to outpace on-premises growth, benefiting most from the ongoing experimentation in AI. This dynamic underscores a broader transition within the industry, where legacy systems are struggling to keep pace, and the emerging technologies, while promising, are not yet large enough to fully offset the softness in traditional areas.
As we’ve previous suggested, this cycle will continue until Gen AI initiatives throw off enough cash to be self-funding. We expect to organizations to have better visibility on the payback timeframe this year but not until well into Q4.
What do you think? Are you seeing quick wins in Gen AI? How about big returns? If so for what use cases? Or , like many customers, are you still in the experimental phase looking for gold?
Let us know.


