The ever expanding cloud has become ubiquitous. No longer is the cloud some remote set of services, somewhere up in the sky. Rather, the cloud is seeping into every industry, hybrid on-prem models, edge workloads, telco markets and has its sights set on space. The market size is staggering and will surpass $1T in revenue in 2025 when including infrastructure (IaaS and PaaS), SaaS and professional services. Much AI work is being done today in the public cloud and despite indications that bringing AI to on-prem data will be a growing trend, it’s unlikely that the cloud will stop expanding any time soon.
In this Breaking Analysis we share our latest cloud market update with an expanded view beyond the typical Big four hyperscalers on which we typically focus. We’ll also break down the market in more granular detail with the addition of four vendors and a more comprehensive view of the overall market. In addition, we’ll drill into the IaaS and PaaS markets and set up a framework for future research.
Customers View Their Clouds in Myriad Dimensions
First let’s start with the survey data from ETR to understand how customers think about their cloud platforms.
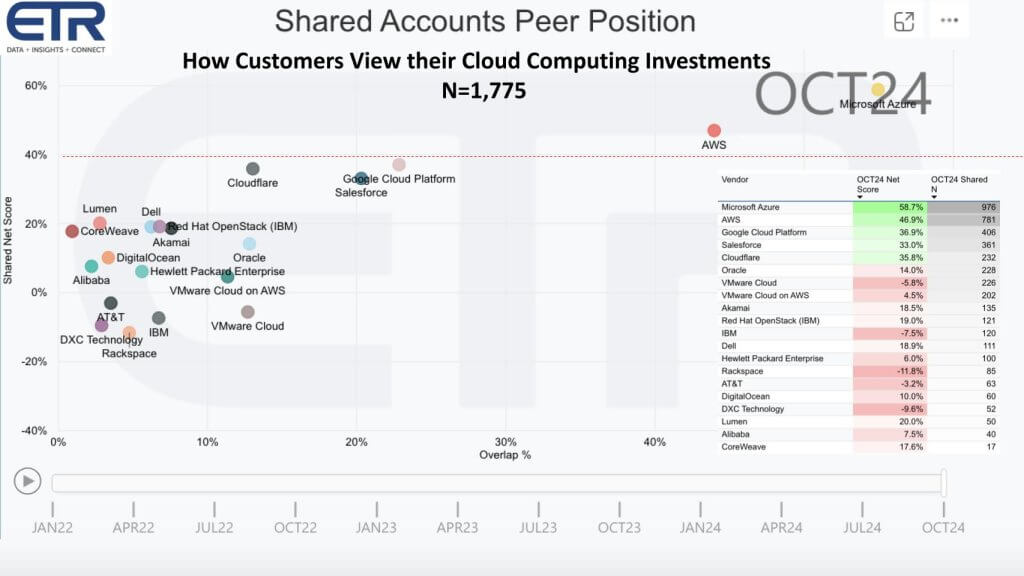
This two dimensional chart above is a common view we like to share. It’s based on ETR’s October TSIS survey (Technology Spending Intentions Survey) of 1,775 IT decision makers. This view represents the cloud computing sector. Approximately 1,200 of those 1,775 respondents in the N above provided data on their cloud platform spending patterns. The vertical axis shows Net Score or spend momentum on a particular platform and the horizontal axis shows Overlap or penetration within those respondent accounts.
The table insert shows each vendor, their Net Score and the N number of responses, which is an indication of market penetration. This data informs how the dots are plotted. You can see Microsoft and AWS are prominent and dominant with 976 and 781 N respectively. Note the red line at 40%. That’s an indication of a highly elevated Net Score and only AWS and Microsoft are above that line. Google Cloud is close to that line and we’ve seen increased penetration on the X-axis since the launch of ChatGPT. It’s clear AI is a tailwind for Google as it closes in on AWS within the ML/AI sector (not explicitly shown). Notice Salesforce and now CoreWeave has hit the list for the first time. Dell, Red Hat, IBM, HPE, Oracle, VMware, Rackspace, DXC, AT&T, Digital Ocean, Cloudflare, Alibaba, Akamai, Lumen also show up on the chart.
The point is, this is how customers view cloud when you ask them which clouds they’re using. Their responses represent a wide variety of platforms. From public cloud hyperscalers, to SaaS companies to service providers, hosting companies and more.
Sizing the Expanded Definition of Cloud
With this background it’s a good point to look at a more comprehensive view of the cloud market than in our previous episodes. In other words a view of the cloud market beyond the four big hyperscalers and one that aligns more closely with how customers look at their clouds.
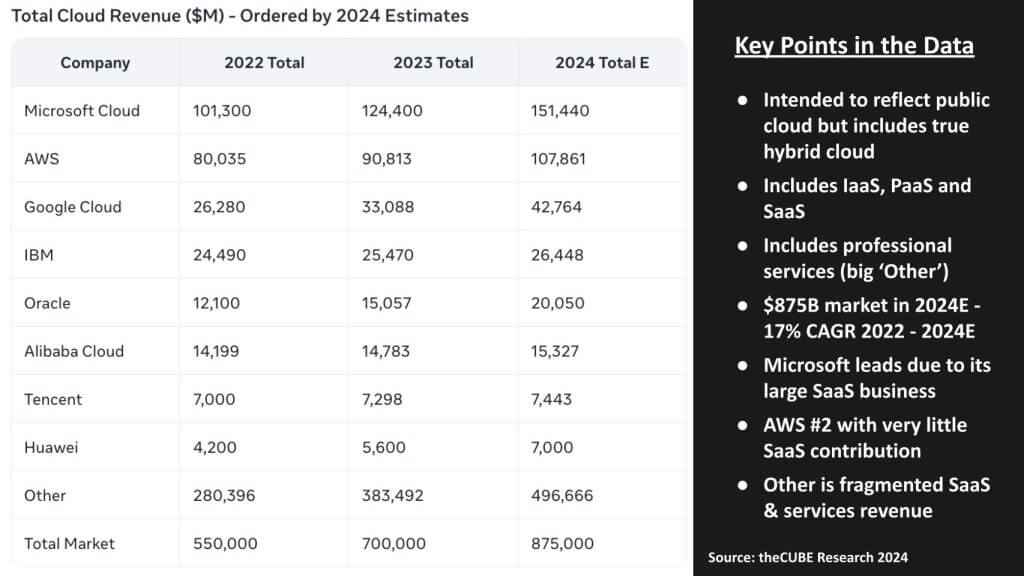
The table above shows our attempt to size the total cloud market. We’ve expanded the scope beyond the fouro hyperscalers we usually focus on (AWS, Azure, GCP and Alibaba) to include hybrid cloud players like IBM and Oracle, which both own public clouds, and two additional cloud players in China, Tencent and Huawei. We’re attempting to size IaaS, PaaS, SaaS and include cloud-based professional services. Notice the big other, which includes both other SaaS and professional services.
We pursued a top down methodology to size the overall market using the following logic. IT spending is around $5T worldwide, of which about two thirds is staffing. So that means about $2T is vendor revenue and cloud at $875B makes up about 40% of that spend, a figure we’ve derived from our work with ETR survey data and other information we’ve modeled over the years. The total market is growing at a 17% CAGR from ‘22 – ‘24. You can see Microsoft is #1 because of its large SaaS contribution. AWS is second in this view with very little SaaS and services.
At these growth rates, the market surpasses $1T in 2025.
Drilling into IaaS Market Shares and Sizing
The previous data provides a view of the very big picture of cloud computing. Let’s break it down further starting with IaaS. IaaS is infrastructure-as-a-services and includes the core compute, storage and networking services. We also include in our definitions services such as load balancing, any built-in security, gateways and other core infrastructure.
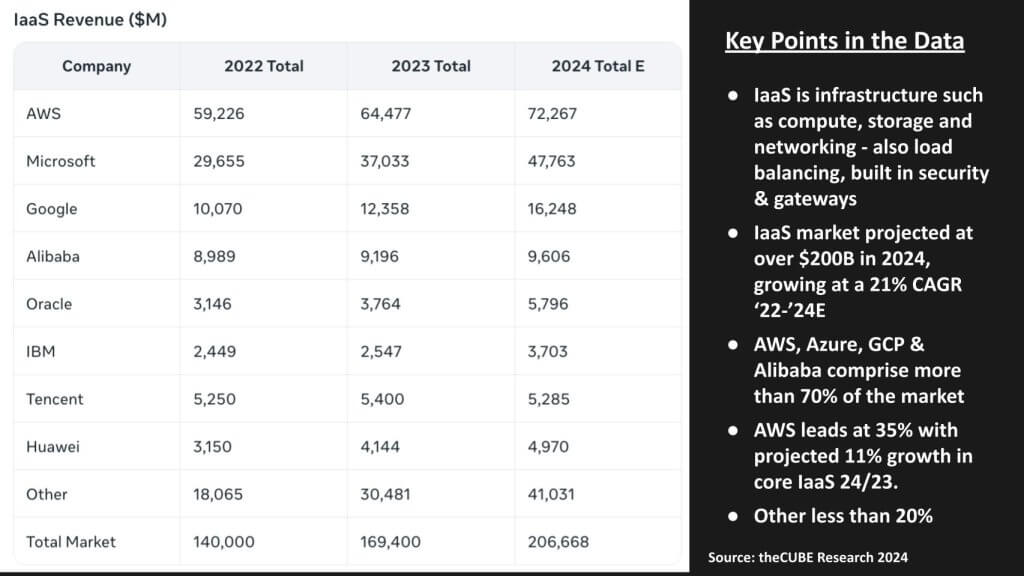
The market as shown aboveis projected to approach $207B in 2024, which is a 21% CAGR from ‘22 – ‘24. AWS, Azure GCP and Alibaba dominate with more than 70% of the market. AWS leads with 35% of the market and we believe its IaaS business is growing more slowly than its overall cloud business as AWS’ PaaS mix increases and SaaS grows from a much smaller base.
Oracle is a big growth story in this space as it gears up OCI, procures GPUs from NVIDIA and provides mission critical database and application infrastructure powered by AMD, Intel and Ampere. Meanwhile the players in China are sorting through local market economic challenges and some restructuring of their cloud business models. But as you can by their revenue, they are major players in local China and Asia Pacific regions.
Unlike in SaaS and services, “Other” in this segment accounts for less than 20% of the revenue.
Platform-as-a-Service (PaaS) Supports Application Builders
Let’s take a look at the platform-as-a-services projections. PaaS includes core database and related services, analytics, application services, streaming, machine learning and AI tools and related platform services. The market, as shown below, is projected to grow to over $80B this year at a 25% CAGR from 2022 – 2024. As with IaaS, the big four cloud players account for more than 70% of the market and the “Other” players are less than 20%.
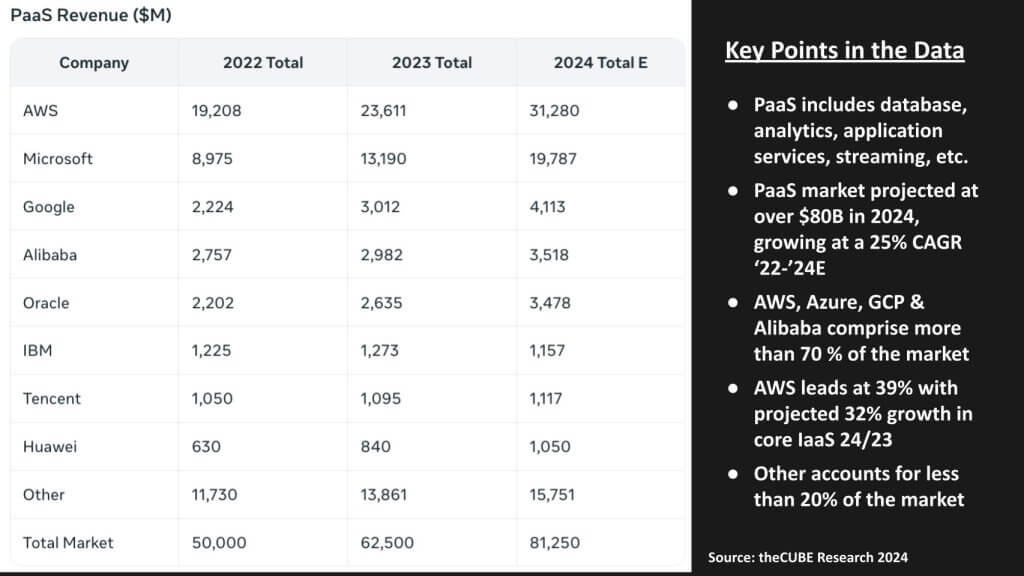
PaaS is increasingly strategic and is the glue between infrastructure and applications.
Sizing the Cloud SaaS and Professional Services Market
Our top down bottom up methodology takes our estimates of IaaS and PaaS and subtracts them from the total market to quantify the leftover portion of the market which we have assumed represents SaaS and cloud professional services. In total it represents more than $500B in 2024 estimated revenue, of which we believe just over 50% represents professional services. So roughly speaking, our 2024 Estimates are as shown below:

We’re not ready to expose our SaaS and cloud professional services granularity at the moment. You saw in the ETR data names like Salesforce and DXC, representing both software and services firms. But there are many more. Servicenow, Workday for example in SaaS and Accenture in services. IBM is services and SaaS heavy as are many others. Unlike IaaS and PaaS, where “Other” comprises less than 20% of the market, in SaaS and Services, our “Other” category currently accounts for almost 75% of the spend. So we need to do more work before we release that data to the public.
Notably, the marginal economics of SaaS are extremely attractive, whereas the same is not true for professional services. As such separating those two is an important next step in our research.
Combining IaaS and PaaS Market Views
We’ll close with a consolidated look at the IaaS and PaaS spaces, stripping out Microsoft’s large SaaS business. Same with Google. This gives us more of an apples-to-apples comparison with AWS’ business.
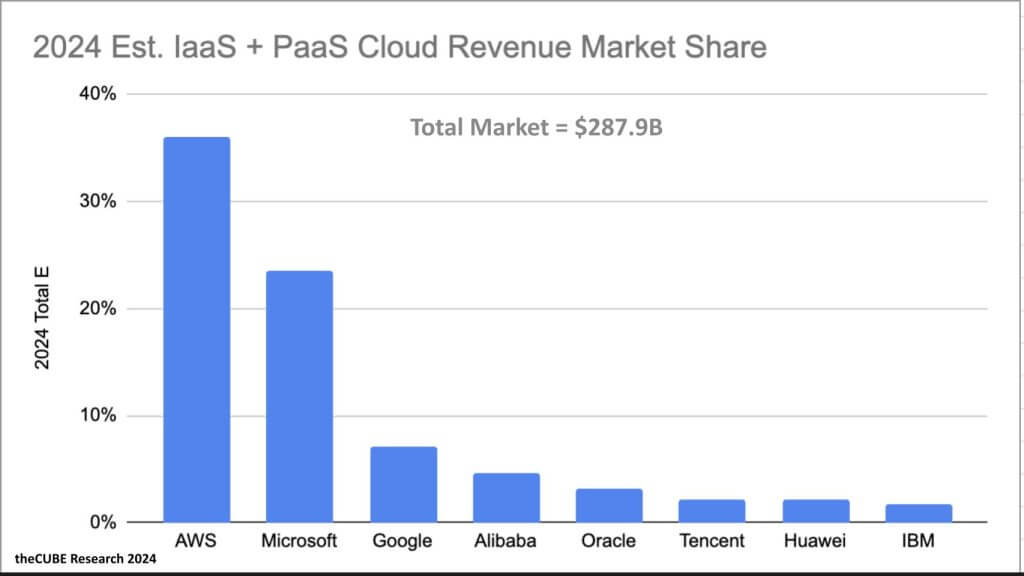
Above we show the revenue shares for our eight cloud companies in the combined IaaS/PaaS cloud market at nearly $300B projected for 2024. AWS has 36% of this combined market, Microsoft 23% and Google 7%. Alibaba, Oracle Tencent Huawei and IBM combine for around 14% of the market with “Other” (not shown) at 20%
The cloud market continues to grow rapidly, driven by increasing adoption of cloud services across industries. AWS, Microsoft and Google remain the top players, while Oracle and other players are gaining traction.
When including SaaS and services and accounting for the preponderance of “Other” players the market takes on a different dimension. The SaaS and services markets are highly fragmented and while much of the SaaS industry runs on the public cloud, the revenue captured by non-hyperscalers is substantial. Professional services, always the largest category, consumes another big chunk of revenue.
Remember, these models use a combination of top down and bottom up methodologies. The Iaas and PaaS figures for AWS, Microsoft, Google and Alibaba have the highest degree of confidence. Notwithstanding the fact that interpreting financial data and mapping to create an apples-to-apples comparison is as much art as it is clean financial math. The Oracle and IBM data are somewhat more precise than the other vendors, however both firms have somewhat opaque and often fluctuating reporting methods for their cloud businesses with frequently changing definitions. But anecdotal data is strong for both companies given their respective histories and US-based locations. As well, survey data is more available for these US-based firms. The data on Tencent and Huawei are interpreted through bits and pieces of information, financial reports, limited survey data and conversations with local sources in China, including individuals in the community that have visibility on those firms.
Much of the SaaS and services data is interpreted through top down methodologies, taking into account financial statements, management commentary on cloud performance, guidance on earnings calls and subtracting IaaS and PaaS estimates from total cloud figures, which we derived based on the top/down methodology discussed earlier. As indicated the SaaS and services markets are highly fragmented, definitionally opaque in earnings reports and extremely large. The same is true for “cloud” as each vendor has a different interpretation of what they include in their cloud reporting.
So there you have it. We’ve tried to give you additional granularity in our data sets as a service to the community. We’ll continue to refine this over time and appreciate your feedback on where you think we got it right and how we can improve the models.
Let us know.


