Based on this quarter’s earnings reports, it’s clear to us that demand is not the constraint for hyperscale clouds. They are, however running head‑long into the hard limits of physics. Access to megawatts, liquid‑cooled racks, and a GPU supply chain that begins and ends with NVIDIA (and TSMC) are now critical paths to tapping what appears to be unlimited demand. AWS, Microsoft, and Google each chalked up record‑setting capital outlays last quarter—collectively dropping around $63 billion in CAPEX—yet even that eye‑popping sum can’t fully satiate the compute‑hungry AI models racing toward trillion‑parameter scale. We believe the real story isn’t simply “AI is expensive”; it’s that power availability, not revenue potential, is now the gating factor on hyperscaler growth. In our view, the winners of the next cycle will be the providers that secure sustainable energy footprints, master GPU allocation, and—importantly—translate all that infrastructure into margin‑accretive AI services to reach breakeven on these investments.
Welcome to the ironic era where megawatts equal market share.
In this Breaking Analysis, we pivot off of last week’s earnings prints from Microsoft and Amazon, and fold in Alphabet’s results from last month, to give you our most current take on the state of the public cloud. We’ll review the key nuggets from the quarter, give you the positives and negatives for each of the three firms, update you on our latest 2025 revenue and market share projections, share some current spending data from ETR and close with the key indicators to watch in the coming twelve months and beyond.
Quarter in Review – Hyperscalers Power Through Macro Headwinds
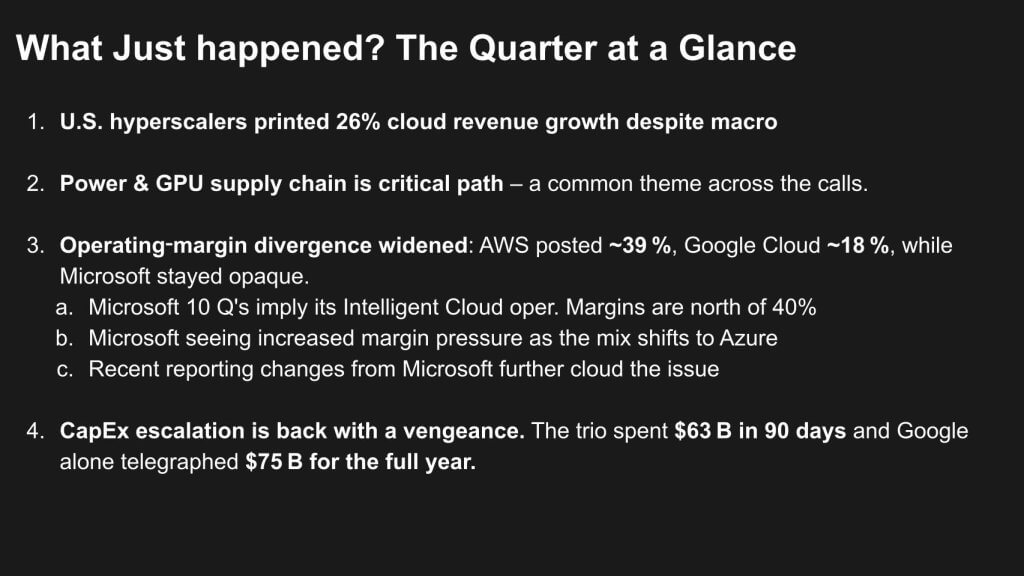
In our view, the data below depicts a simple but important message in that the three US hyperscalers just logged 26 % year‑on‑year growth—more than $59 billion in IaaS and PaaS revenue alone—despite a decidedly choppy macro backdrop. Retailers are cautious, IBM flagged potential softness, Amazon’s statements on its own e‑commerce business were cautious, yet AWS, Microsoft and Google Cloud keep compounding.
There are three structural themes we’ll call out from the numbers:
- Power & GPU scarcity continues to be center‑stage. Executives repeated the phrase “critical‑path” when discussing megawatt availability, liquid‑cooling capacity and NVIDIA supply. Demand is apparently not the issue. Rather reliable sources of energy are the gating factor.
- Margins in focus. AWS remains a profit benchmark at ~40 % operating margin. Google is crawling up from last year’s negative base. Microsoft didn’t disclose quarterly cloud margin but its 10Q reported low 40%ish operating margin for its Intelligent Cloud business. Microsoft in our view is masking margin dilution from Azure and perhaps explains its opaque reporting and recent re‑definition of what’s inside “Azure and Other Cloud Services.”
- CapEx acceleration resumes. The trio poured $63 billion into infrastructure last quarter; Google alone signaled $75 billion for the full year. We believe this arms race is rational so long as depreciation schedules align with AI revenue ramps—but physics could become the limiting factor.
Finally, making apples‑to‑apples comparisons remains a challenge. Microsoft blends SaaS, on‑prem software and Azure into multiple “cloud” buckets; Google bundles Workspace in its cloud reporting and doesn’t separate out GCP. AWS is the only vendor printing discrete IaaS/PaaS revenue since consistently, but it doesn’t have a major SaaS business to speak of. In our upcoming sections we normalize these definitions to try and make consistent comparisons.
KPI Scorecard —The Numbers Behind the Hype
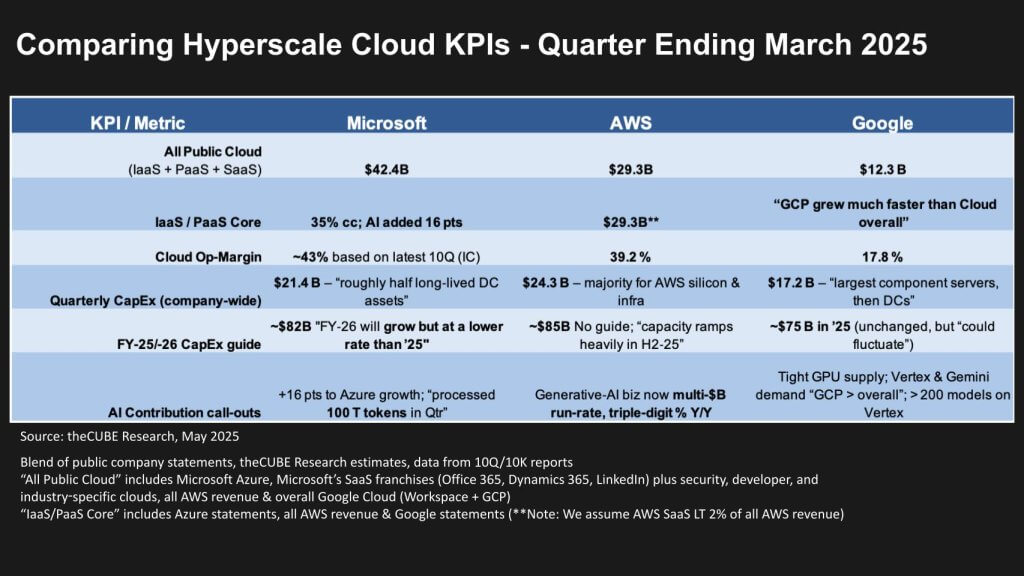
The next set of data summarizes the cloud reporting for Microsoft, AWS, and Google. It’s our best attempt to make the hyperscalers comparable—even though each vendor’s definitions vary widely.
Below we explain the categories in more detail.
All‑In Public Cloud Revenue
- Microsoft: ~$42 B last quarter. Satya Nadella led with that figure in his remarks on the earnings call. This lumps Azure, Office 365, Dynamics, LinkedIn, security clouds, and every industry service into one cloud number. At the current trajectory Microsoft’s all‑in cloud will blow through $160 B a year.
- AWS: $29.3 B— Amazon’s numbers are currently the cleanest of the set. Everything sits in one segment; SaaS is a rounding error (<2 %). But if that changes we suspect AWS will become increasingly difficult to track.
- Google: $12.3 B. Workspace is baked in, so the figure is half productivity suite, half infrastructure by our estimates.
Core IaaS / PaaS
- AWS core: $29.3 B—essentially the same as the all‑in figure because SaaS is de minimis.
- Azure core (our model): roughly $23 B. This number is a moving target; leaked Activision‑trial docs helped us to revise down from earlier estimates. Microsoft’s constant re‑definition—pulling slow growth legacy mobile and other services out, and replacing with high growth AI —deflates the absolute Azure figure (which Microsoft doesn’t report) and inflates the growth rate.
- GCP core: we peg it at $6.1 – 6.2 B for the quarter, on pace for ~$28 B this calendar year—about half of Google’s total cloud business by our estimates.
Operating Margin
- AWS: 39.2 %—impressive given the lack of SaaS contribution.
- Microsoft (Intelligent Cloud): low‑40 % range based on 10Q reports, but remember this masks Azure’s drag.
- Google Cloud: high‑17 %, up from negative last year. Good progress but the company has a long way to go to catch the two profit leaders.
CapEx Fire Hose
- Microsoft: >$20 B for the quarter; we model $80 B+ for FY‑25.
- AWS: $24 B—majority in silicon and data‑center buildouts, with some not minor spillover into Amazon.com logistics. Management hinted at a heavy ramp in 2H‑25, which could push full‑year spend past $80 B.
- Google: $17.2 B and the only hyperscaler to lay down a firm public guide this quarter— reaffirming $75 B for the year, subject to quarterly swings.
Google also has a hidden benefit in that it runs an enormous cloud network for its search and youtube businesses. Every watt and rack it frees up by optimizing these existing data centers can be redeployed to GCP. That internal hand‑me‑down cycle short‑circuits the years‑long real‑estate hunt Microsoft and Amazon are slogging through.
AI Contribution
- Microsoft: says 16 points of Azure’s 35 % constant‑currency growth came from AI. Depending on how you interpret that, the more positive math suggests Azure‑AI will break through $10 B in CY‑25.
- AWS: Andy Jassy called generative‑AI a “multi‑billion‑dollar run rate” business growing triple digits—very promising, but still small against a $117 B annualized base.
- Google: signaled it’s tight on GPU supply, leaning on TPUs, Vertex AI, and Gemini. Google touts more than 200 models on Vertex today, and management claims it’s the only hyperscaler with a true foundation model in‑house.
Why This Matters
- Optics vs. Economics: Microsoft’s definitional games boost growth and this quarter helped Microsoft surprise the street – blowing away its Azure growth number. But it’s opacity masks how much the AI build‑out is dragging on Azure margins.
- Power Is the Governor: Each provider’s CapEx only pays off if the megawatts come online. Right now, electrons are the gate.
- Apples‑to‑Apples Comparisons Remain Elusive: Until Microsoft and Google carve out clean infrastructure numbers, we’ll keep triangulating leaked court docs, 10‑Q footnotes, and CFO breadcrumbs.
Net‑net, AWS’ profit benchmark is notable, Microsoft has a nice funnel from its on-prem/hybrid business, and Google is the swing player whose TPU economics could reset the cost curve—provided it can light up enough capacity. The same is definitely true for AWS with Trainium 2 and Inferentia. Microsoft as well is developing its own silicon and while later to the game than its two competitors, at Microsoft scale we believe this will confer meaningful cost optimization.
Let’s now dig into each player
Microsoft – When Legacy Turns Into Leverage
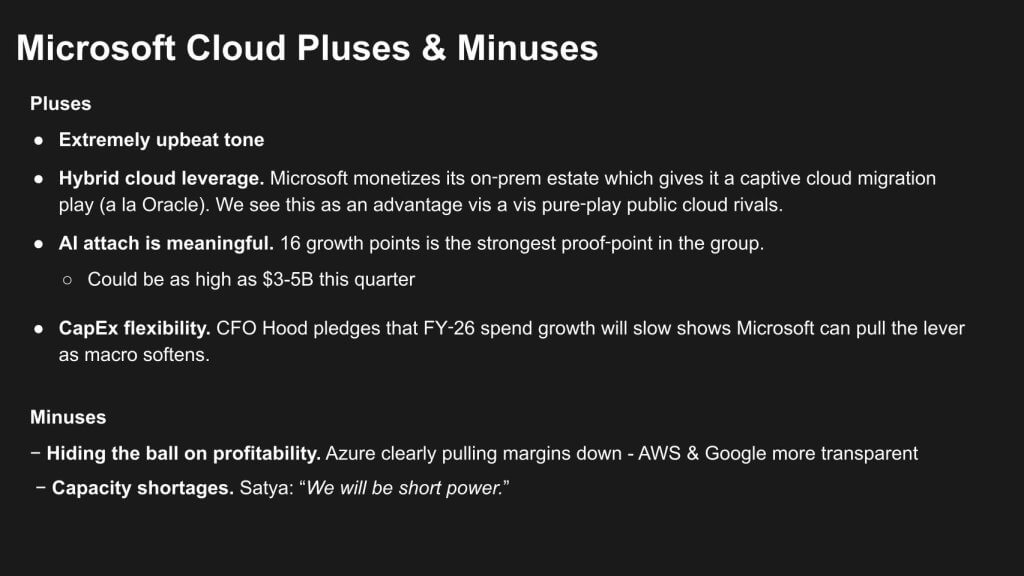
Microsoft’s March‑quarter call was the most upbeat we’ve heard from Satya Nadella and Amy Hood in years. The vibe wasn’t hype; it was grounded in real numbers. First, the company’s vast on‑prem footprint is turning into a strategic weapon in our view. Far from being an anchor, that legacy estate throws off loads of cash and offers customers a low friction path to Azure. If the experience in Microsoft’s cloud feels “substantially identical” to what runs in their data centers, most CIOs will see little reason to switch vendors. That advantage showed up in the metrics. Azure grew 35 percent in constant currency and roughly half of that growth—16 percentage points—came from AI services. By our math, that translates to three to five billion dollars of new AI revenue generated in a single quarter. On capital spending, Amy Hood emphasized flexibility. Microsoft can—and will—dial CapEx back in fiscal ’26 if macro conditions soften, preserving cash flow while the current build‑out depreciates.
The negatives on Microsoft’s quarter are limited. Profit transparency remains a sore spot. Azure’s rapid expansion is pulling Intelligent Cloud gross margin below 70 percent, but the impact is hard to isolate because Microsoft bundles Azure with legacy Windows Server and SQL revenue in its IC category. Whereas AWS and Google disclose clear operating‑margin snapshots; Microsoft leaves analysts to triangulate footnotes and dig through 10Qs. The other concern is capacity. Power, real estate, and GPU shortages could govern near‑term upside. It’s a “good” problem—better to be supply‑constrained than demand‑starved—but it’s still a constraint that could blur growth optics in coming quarters.
Net‑net: Microsoft crushed its quarter. The firm’s hybrid franchise lets it mint cash while scaling AI. The only real knock is that we’re still squinting through the data to pin Azure’s stand‑alone revenue and profitability—and the guessing game won’t end until management decides transparency is worth the trade‑off.
AWS – Margin Monster With a Messaging Challenge
AWS delivered a solid quarter relative to our expectations—17 percent top‑line growth to just over $29 billion, a nice beat above our 16 percent model forecast. Wall Street, however, was looking for more and chose to focus on Azure’s 35 percent surge, pushing Amazon’s stock lower. We don’t buy the “losing momentum” narrative that some analysts are touting.
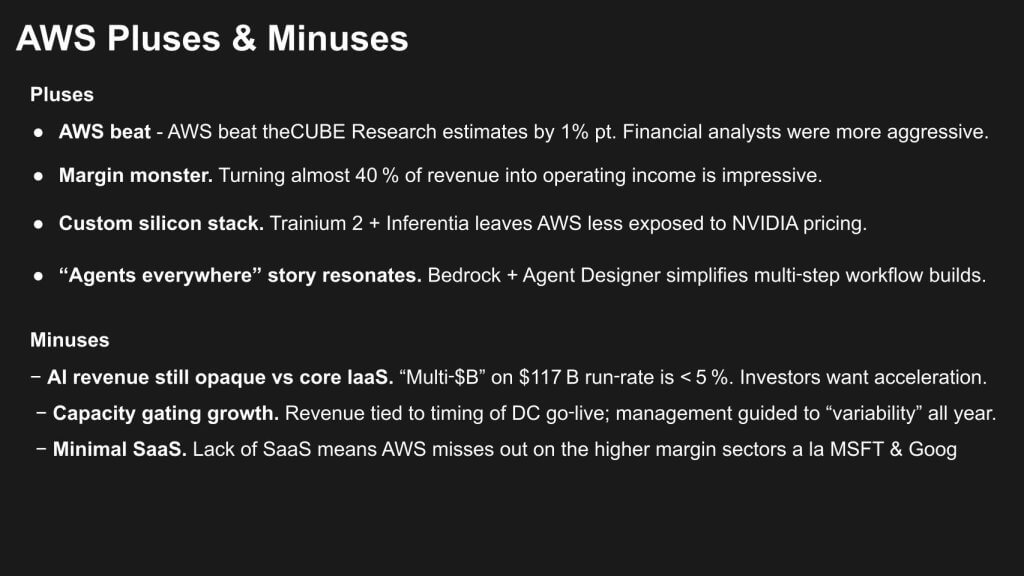
On the plus side, AWS is still a profit juggernaut, cranking out operating margins just shy of 40 percent—an enviable figure in any sector, let alone infrastructure. Its custom‑silicon roadmap is years ahead of rivals. Graviton reset the CPU cost curve; Trainium 2 and Inferentia are now doing the same for AI, leaving AWS less exposed to NVIDIA’s pricing power. Management is also moving up the stack with Bedrock, Agent Designer, and a slew of domain‑specific agents that aim to make generative AI a turnkey service rather than a science project. We see AWS making substantive progress in AI.
The knocks are mostly about perception and mix. AWS lacks a SaaS layer, so it misses the higher‑margin boost Microsoft gets from Office 365 or Google from Workspace. The segment’s $117 billion run‑rate looks great in isolation, but investors want a stronger growth story when Azure is flashing meaningfully higher growth percentages. Guidance didn’t help; Amazon trimmed the low end of its forecast range, which some took as caution bordering on pessimism. We see it as prudent management in a world where power permits, not deal pipelines, govern revenue ramps.
Capacity is the true governor. AWS growth is tied to how quickly new data‑center campuses come online with enough megawatts to light them up. Brian Olsavsky reminded analysts that timing could swing quarter to quarter. Until Amazon layers in more SaaS‑like revenue or breaks the power‑constraint ceiling, the headline numbers may underwhelm the momentum crowd. Nonethless, our model calls for accelerated growth throughout the year as more capacity comes on line.
Net‑net: AWS remains a margin benchmark and the silicon innovator in cloud, but its narrative looks soft next to Microsoft’s AI‑juiced percentages. The real limitation isn’t demand; it’s how fast Amazon can energize new regions and prove that custom silicon plus agents can re‑accelerate growth.
Google Cloud – Quiet Momentum With Heavy Lifting Ahead
Google reported its numbers a few weeks earlier, but the Microsoft and AWS prints give fresh context. Headline cloud growth came in at 28 percent—below Azure’s pop, yet still solid. Double click into core infrastructure and the picture gets even better. Our model pegs GCP at roughly 36 percent growth, edging out Azure’s 35 percent on a much smaller base and pushing the infrastructure franchise toward $27‑plus billion for the year. That’s still well behind AWS and Microsoft, but it confirms steady share gains.
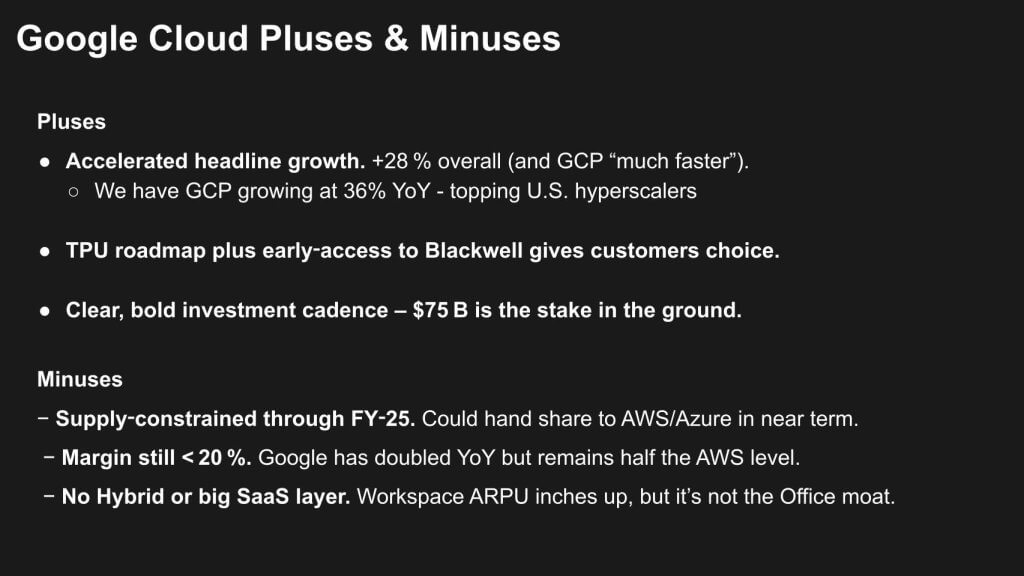
On the plus side, Google’s TPU roadmap is world class. The company rolled out its next‑gen Tensor Processing Unit at Cloud Next and, like other big players, has secured early access to NVIDIA’s Blackwell, giving customers genuine choice at the silicon layer. Management also planted a clear CapEx flag—$75 billion for the year—telegraphing long‑term intent. Supply constraints remain an issue, yet we believe GCP will grow at or above Azure’s pace and faster than AWS in 2025, setting Google up as the share gainer of the cohort.
Margins are the sore spot. Operating income has clawed from red to high‑teens, but that’s still well below AWS’s 39 percent and our low‑40 percent read‑through for Microsoft’s Intelligent Cloud. The drag underscores how aggressively Google is pouring dollars into GCP—despite running a respectable SaaS layer in Workspace. If roughly half of revenue comes from software, you’d expect fatter margins; the fact that we don’t see them yet is a testament to the scale of data‑center and AI investment still underway.
Hybrid awareness helps. Google acknowledges that on‑prem and sovereign environments matter and the company continues to expand Anthos and partner solutions. Workspace isn’t Office, but it gives Google a stickier surface area than AWS enjoys. Over time that could inch margins higher, provided the infrastructure build settles into a steadier depreciation rhythm.
Net‑net: Google Cloud is quietly putting up the fastest core‑infrastructure growth among the Big Three, driven by an aggressive TPU roadmap and a clear CapEx plan. The trade‑off is sub‑20‑percent operating margins and ongoing supply bottlenecks. If Google can fire up capacity on schedule and convert Workspace momentum into broader SaaS leverage, it will keep chipping away at AWS and Microsoft share. Until then, investors will have to tolerate thinner profits in exchange for outsized top‑line traction.
Big Three Cloud – $245 B and Climbing
The chart below isolates the IaaS and PaaS data for the three U.S. hyperscalers. On an apples‑to‑apples IaaS / PaaS basis, AWS grew 17 percent, Azure 35 percent, and GCP 36 percent in the March quarter. We slot Alibaba at an estimated 15 percent—good enough to keep it in the “Big Four” for now, even if some purists would rather drop it. Stack the numbers and the big three hit nearly $60 billion in three months.
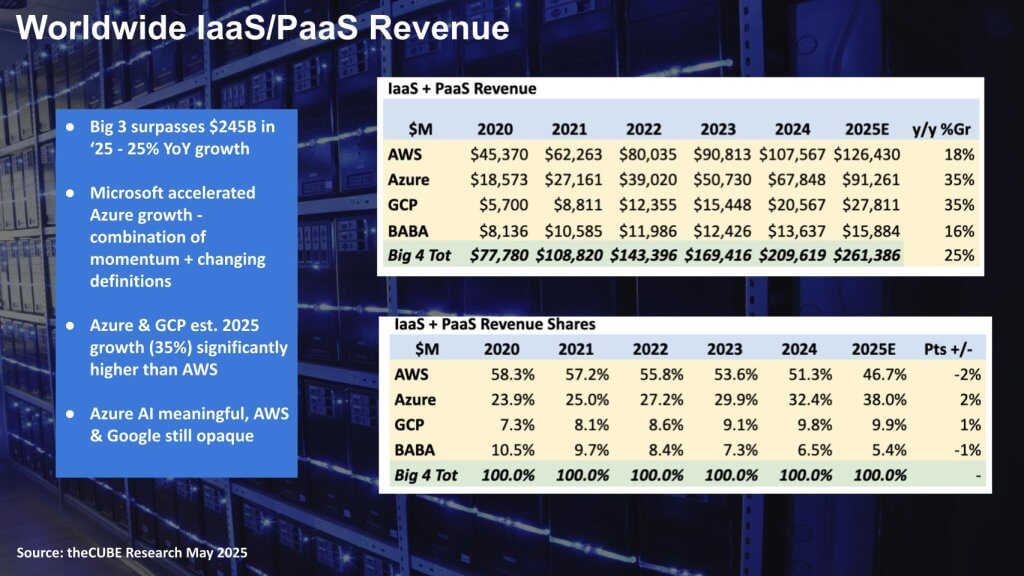
Roll those growth rates forward and the math gets eye‑popping. We expect the Big Three (AWS, Azure, GCP) to break through $245 billion in 2025, up roughly 26 percent year over year. Azure and GCP should clip along at about 35 percent for the year; AWS, hampered by power and GPU constraints, should still accelerate into the high‑teens once new regions energize. Alibaba is a wildcard with slower growth on paper and fluctuating policy from China. China’s AI prowess could confer advantage to firms like Alibaba and we may see upside surprises.
What jumps out is Azure’s acceleration is both real and, manufactured. Microsoft’s definitional gymnastics—pulling slower‑moving legacy services out of the Azure mix, and shoving fast‑growing AI into the top line—shrinks the baseline so the growth rate looks better. It’s clever, and it works; Wall Street loves a headline. But even after you adjust for the accounting games, Azure’s momentum is legit, driven by a tidal wave of AI attach.
The broader takeaway: macro fears—tariffs, stagflation, a possible recession—aren’t derailing cloud. The Magnificent Seven have the balance sheets and cash flow to muscle through power shortages, supply snags, and geopolitical scuffles. Apple, despite its China headaches, and the cloud trio, despite energy bottlenecks, all have the resources to figure it out. It might take time, but history suggests they’ll power through—and monetize by the millisecond.
ETR Spending Momentum – Cloud Still Tops the Priority List
For the first time on Breaking Analysis we’re sharing ETR’s “Shared Net Score” in a series of trendlines, and it’s a telling story (see below). The dataset tracks more than 1,800 senior IT decision‑makers from 2021 through today, plotting spending momentum for Azure (orange), AWS (green), and Google Cloud (light blue). Shared Net Score measures the percentage of customers planning to increase spend on a given platform netting out those trimming budgets. A red dotted line at 40 percent marks a highly elevated indicator.
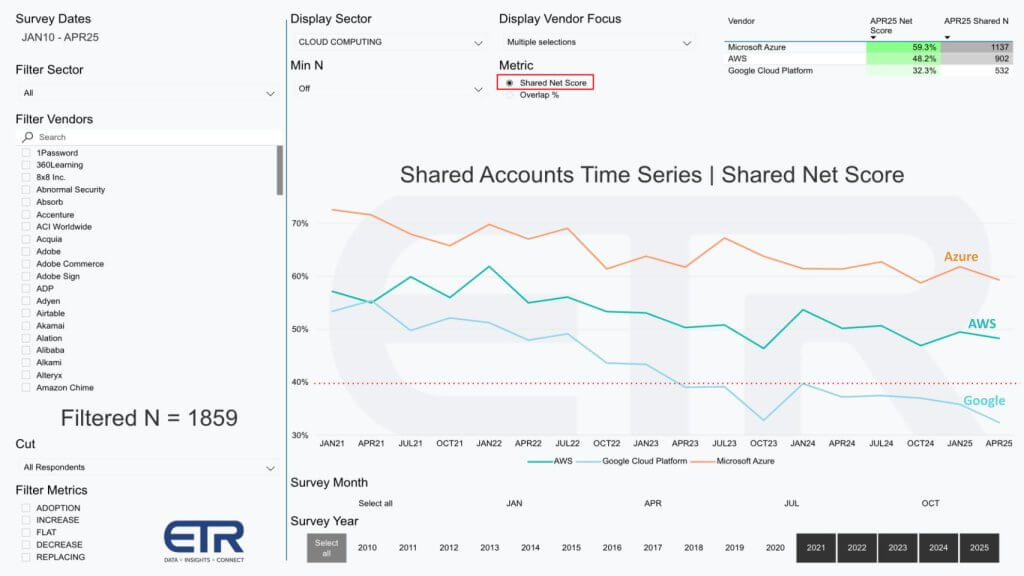
Unsurprisingly, all three clouds are down from their 2021 levels at height of the COVID rush when everything moved online, then tapered as macro headwinds set in. Yet even with the decelaration, every provider still sits near or above the 40‑percent zone. Azure and AWS hover well north of the line; Google flirts with it, dipping slightly in the latest cut, which bears watching. This is a forward‑looking metric, meaning respondents are telling us where budgets are headed, not where they’ve been. The takeaway: despite cost scrutiny, cloud remains a budget priority for CIOs.
Momentum has cooled from the pandemic sugar high, but the category’s baseline is still stronger than most other enterprise‑tech segments ETR tracks. Even Google’s modest dip lands it in territory most vendors would kill covet. In short, the survey confirms what the revenue prints already suggest—demand isn’t going away; it’s simply normalizing to a more sustainable, albeit still elevated, glide path.
ETR Data Shows Cloud Continues to Gain Wallet Share
The following data flips the lens from spending velocity to account penetration—ETR calls it “Overlap.” Using the same 1,859‑firm panel, ETR measures which clouds are actually deployed in these shops today? The results are revealing. Azure shows up in north of 60 percent of all accounts surveyed, cementing its position as the most ubiquitous platform in enterprise IT. AWS is embedded in just under half of the organizations—about 50 percent—still formidable but a notch below Microsoft’s reach. Google Cloud, meanwhile, has vaulted from the high teens a few years ago to roughly 30 percent penetration, marking the fastest land‑and‑expand trajectory in the group.
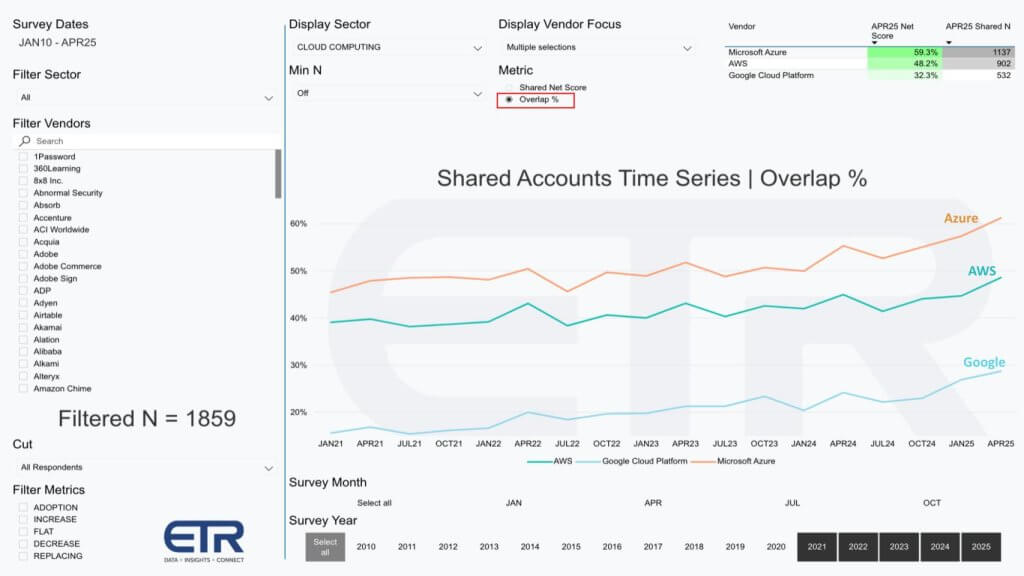
The inset in the upper‑right corner of the slide pairs each provider’s penetration (Shared “N”) with its Net Score. All three firms sit firmly in the green, meaning they combine healthy wallet share with positive spending intent. That alignment—broad footprint plus rising budgets—reinforces our core thesis that cloud is both deeply entrenched and still growing inside large enterprises.
Google’s catch‑up story stands out. Moving from sub‑20 percent to the 30‑percent level in a relatively short window. Google has been improving sales execution and partner leverage. For AWS, the data underscores how much white space remains even for the market leader. And Azure’s 60‑plus percent footprint explains why Microsoft can drive headline growth simply by convincing existing customers to shift incremental workloads—and why its on‑prem legacy continues to pay dividends.
Taken together, the momentum and penetration views tell a consistent story: the hyperscalers have room to run, and they’re running fast.
Looking Ahead 2025 into 2026 – Six Levers to Watch
Let’s wrap with a forward‑looking narrative that we continue to track daily and report on quarterly.
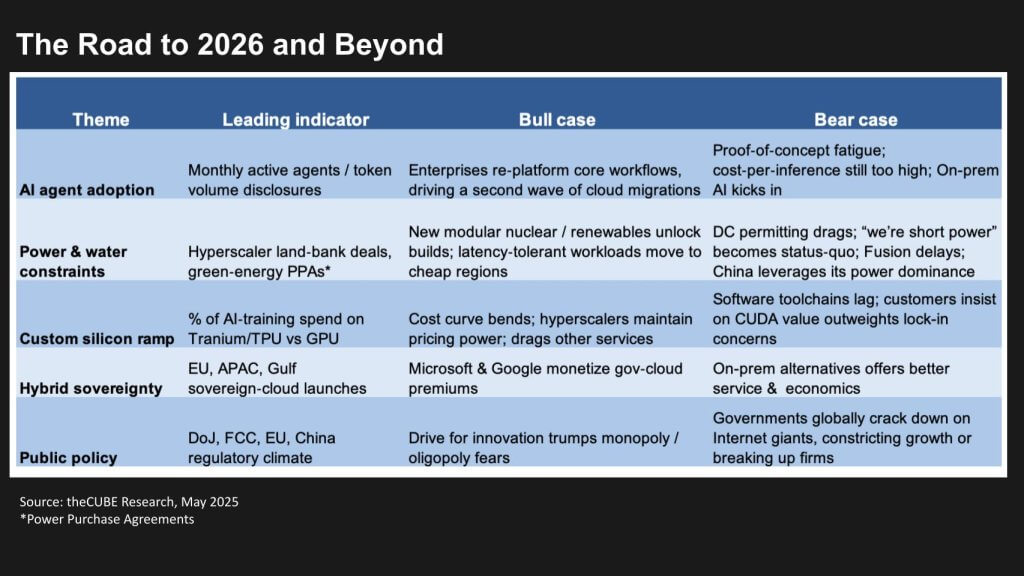
Agentic AI adoption.
The hype needs to further match real engineering progress. We’ll watch monthly active agents and token volume disclosures—the cloud equivalent of DAU/MAU. Bull case: enterprises decide multi‑agent systems run better in hyperscale environments and shift core workflows en masse, kicking off a second migration wave. Bear case: proof‑of‑concept fatigue sets in; large banks and insurers spin up on‑prem AI fabrics for cost control, muting cloud upside.
Power and water constraints.
Land banking, renewable PPAs, modular‑nuclear pilots—those are the early critical signs. Bull case: green energy unlocks gigawatts, latency‑tolerant AI shifts to sovereign zones, and capacity headwinds ease. Bear case: permitting drags become the norm, “we are short power” turns into a standing headline, and nuclear fusion timelines slip another decade.
Custom‑silicon ramp.
How many training cycles run on Trainium, TPUs, or Inferentia versus NVIDIA silicon? Bull case: house chips bend the cost curve, let providers hold pricing, and pull ancillary services into the cloud. Customer adoption and ROI becomes more clear and substantive. Bear case: software toolchains lag; customers stick with CUDA despite vendor lock‑in; NVIDIA keeps its pricing power. Customers struggle to find meaningful business value with AI.
Hybrid sovereignty.
EU, APAC, and Gulf States want sovereign AI. If Microsoft, AWS, and Google turn GovCloud premiums into a margin machine, that’s the Bull case. Bear case: on‑prem alliances—think Dell, HPE, Lenovo, Supermicro with NVIDIA Enterprise—close the ease‑of‑use gap faster than the first cloud cycle, siphoning regulated workloads.
Public policy.
DOJ, FTC, EU antitrust bodies, China tensions—regulation is the wild card. Bull case: innovation needs trump monopoly fears; Washington decides breaking up hyperscalers would hobble U.S. competitiveness. Bear case: global regulators clamp down, forcing structural remedies that slow CapEx amortization and growth.
China wildcard.
Huawei’s brute‑force, power‑hungry Blackwell and NVLink alternatives show what necessity and abundant energy can achieve. Bull case: U.S. clouds keep tech leadership; export controls hold. Bear case: China over‑provisions cheap power, floods rest of world (RoW) markets with subsidized AI gear, and diverts emerging‑market share from the Big Three.
Where to place your bets?
If you can make the strong business case, keep leaning into the cloud. If you’re stuck in POC purgatory and your CFO chokes on cloud AI invoices, an on‑prem stack might balance the playing field. Either way, we’ll track these six levers—because that’s where the game is currently being played.
What do you think? What are you seeing? Where are you putting your bets? Are you putting your AI workloads into the cloud? Are you placing bets on-prem? Are you able to get data center capacity on-prem? Are you able to find the power? Are you in POC purgatory, or you’re starting to really scale those AI workloads? And where are you on agentic?
Let us know.