The agentic era is forcing a reset in enterprise architecture. Agents that take action go well beyond analyzing data sitting in lakehouses. When agents operate on behalf of humans – continuously, at machine scale – they introduce requirements that most enterprises are not engineered for. The so-called “modern data stack” is starting to look like a new form of legacy. Stitched-together systems, fragmented governance, batch pipelines, and perimeter-era security assumptions don’t hold up when the unit of work shifts from a dashboard query to an autonomous decision loop. At agent scale, fragmentation becomes an operational and compliance risk.
This is where we believe Google has an underappreciated advantage. Our research indicates the architectures that will win in the agentic era are the ones that behave like an end-to-end system – where the model, the cognitive engine, and the infrastructure are tightly integrated, operate within a single trusted boundary, and enforce consistent security controls without turning economics into a tax at scale. That is the premise behind our Google thesis. Google has decades of infrastructure and data engineering excellence, and we think it is well positioned to evolve its cloud from a reactive system of intelligence into an environment that can execute in real time, at scale, with durability.
A key reason Google can credibly pursue this direction comes down to full-stack control and deep engineering DNA. Google is one of the few players that can optimize the stack end-to-end – the compute layer (including TPUs), the global network, the security and identity surface, the data engines, and the application layer where enterprise value is ultimately realized. That matters because in an agentic environment, bottlenecks shift constantly – data movement, latency, identity, policy enforcement, cost-per-token. Patchwork platforms struggle to optimize across those variables in concert. Integrated platforms can tune for workload behavior and adjust as demand and constraints change.
Google’s advantage is not just infrastructure. The company has long demonstrated leadership in large-scale data systems – including transactional systems – which we view as central to the enterprise outcomes story. In the agentic era, the database and transactional layer become enforcement points for trust, policy, and auditability – not simply a repository. If agents are going to operate across processes, coordinate actions, and execute transactions, the system must support determinism where it matters, and do so without sacrificing speed.
The market is moving from owning tools to owning outcomes. We see early evidence in pricing models that reward measurable results rather than seats. In our view, Google’s combination of AI-native execution, frontier model strength, full-stack control, and flexibility across clouds, on-prem, and open-source ecosystems positions the company for continued momentum as AI transitions from experimentation to always-on execution at scale.
In this Breaking Analysis – ahead of Google Cloud Next – we update our Google Cloud scenario. We’ll cover market momentum, review spending signals using ETR data, and close with what we’re watching for at Google Cloud Next 2026.
Watch the full video analysis
Capex as Strategy – Google’s Compute Buildout and the TPU/GPU Portfolio
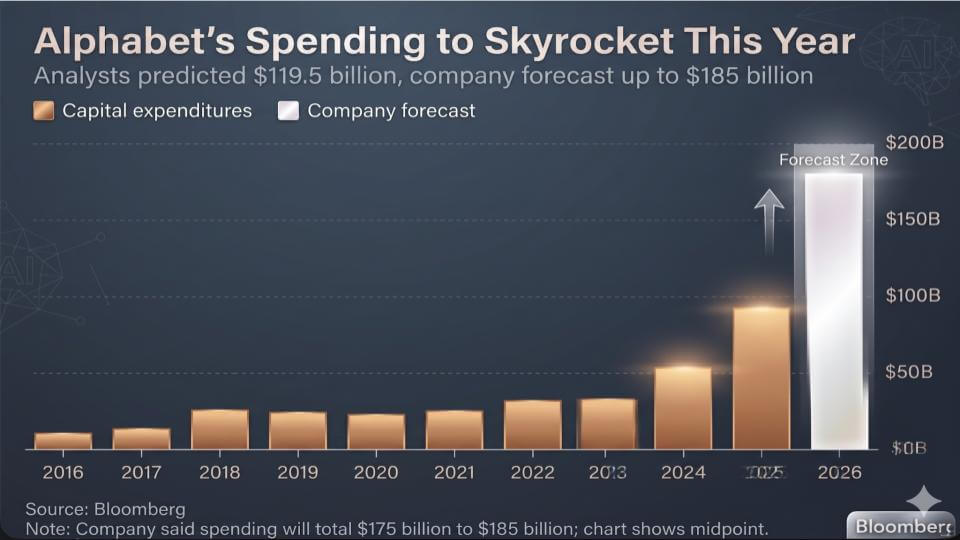
The story that has been driving markets for the last several quarters is hyperscaler capex – and Alphabet is now firmly in the mix of that conversation. The chart below captures the commitment Google is making. Most analysts were modeling roughly $119.5B of capital expenditures, while Alphabet’s own forecast disclosures indicate a figure close to $200B this year The company’s implied range should land us around the $175B–$185B mark. That is a massive upward revision versus prior expectations and it puts Alphabet’s 2026 spend in a different category than the “normal” growth curve investors had been conditioned to expect.
Stepping back, Alphabet is not alone – this is an unprecedented arms race in tech. When we roll Google into the broader hyperscaler set – Amazon, Microsoft, Meta, and Oracle – total capex is on track to hit around $700B this year. The dominant use of that capital is compute and data center infrastructure. For Google specifically, this is roughly a doubling of capex versus prior levels, and it signals a company that is leaning into and trying satisfy massive AI demand.
A key point for this discussion is what that spend is actually buying. Google is scaling its TPU infrastructure aggressively – sourced through its long-standing silicon partner Broadcom – while at the same time securing access to NVIDIA GPUs. That dual source strategy is not uncommon amongst hyperscalers. Our view is that NVIDIA’s full-stack integration across GPUs, networking, software, and associated libraries creates structural advantages in performance-per-watt and time-to-value, particularly as next-generation Vera Rubin systems roll out. Any hyperscaler trying to serve a broad range of AI workloads at scale has to maintain meaningful access to NVIDIA’s platform or it risks falling behind on the workloads that demand that ecosystem.
At the same time, Google’s TPU franchise gives it a second strategic option; and one that is more mature than its cloud competitors. TPUs allow Google to control more of its destiny on cost, supply, and workload optimization – and then use NVIDIA capacity where it is the best fit or where demand outstrips available TPU capacity. Put another way, TPUs are not just a cost play; they are a capacity and control play that allow Google to optimize its vertical stack and fill gaps that silicon alternatives can’t. In a market where demand for compute is exceeding supply, quality compute will find a home. Google’s TPU roadmap gives it a way to absorb more of its own demand while still participating in the broader GPU-centric ecosystem.
The near-term implication is that Google is investing like a company that sees sustainable demand – and sees AI infrastructure as a multi-year platform transition. The more interesting question we’ll address in this note is what Google does with that infrastructure advantage up the stack – and whether the company can translate this capex ramp into sustained cloud momentum and differentiated outcomes for enterprise customers.
Investors are Rewarding the Spend – Because Google Shows the Payoff
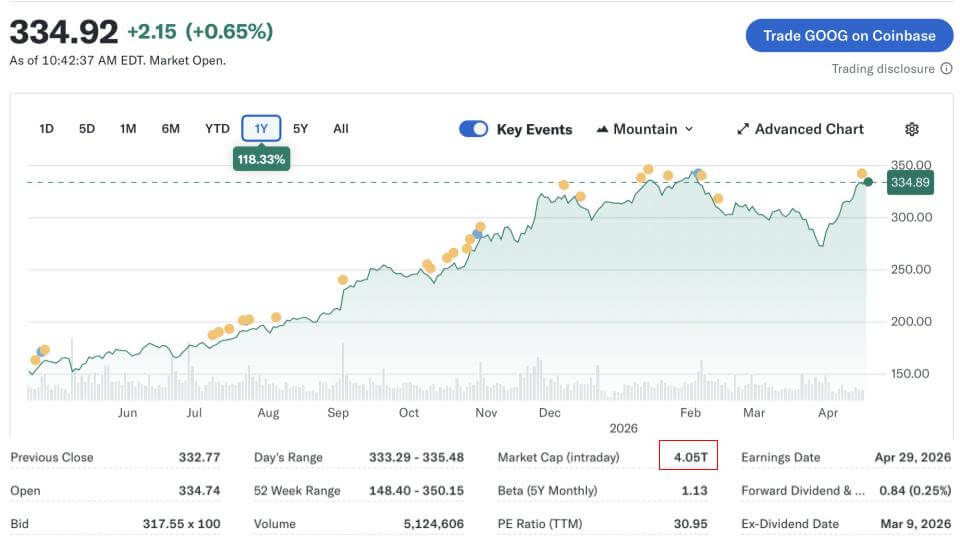
As we’ve seen with other names, a capex ramp of this magnitude triggers real investor concern. The usual reaction is higher spend, lower near-term free cash flow, and a stock that trades down until the ROI becomes more tangible. That is not what has happened with Google.
As the one-year chart above shows, the stock is up roughly 118% over the past 12 months, and the company is sitting at just over $4 trillion in market capitalization as of Friday morning. The dots on the chart are largely earnings-related events and analyst revisions, and the point is that the Street has been leaning more positive than negative as the capex numbers have moved higher.
Why is the market giving Alphabet this much room? Our view is that Alphabet has a more credible ability than most to connect incremental infrastructure spend to incremental return – largely because the core business is still advertising. Ads remain the economic engine that funds the buildout and allows Alphabet to absorb a much larger investment cycle without immediately forcing the kind of margin pressure other companies face when they don’t have a cash machine of that scale.
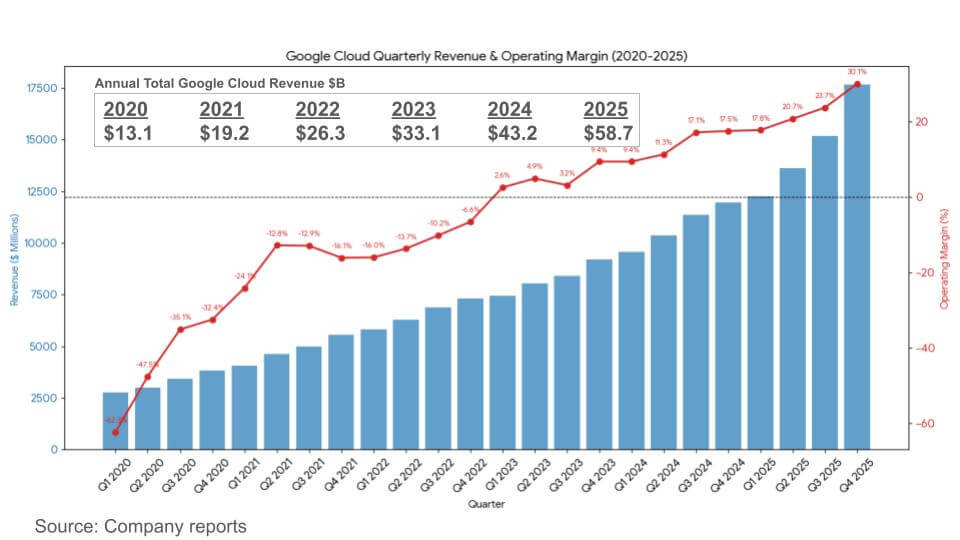
That said, it would be a mistake to dismiss Google Cloud as an important strategic business. While it is still far smaller than the advertising business, it is now a meaningful growth engine in its own right and it is getting stronger. Based on company reporting, Google Cloud is roughly a $72B run-rate business with operating margins have been improving steadily from losses a few years ago to a clear operating profit profile today (see below).
Two key points we emphasize here, including:
Google Cloud is scaling while improving margins – a combination the market rewards because it signals operating leverage.
Second, the business is growing at a rate that is still strong for a cloud platform at this scale. Even with advertising funding the capex cycle, investors want evidence that the cloud business is becoming a durable growth vector and that it can convert the AI buildout into enterprise consumption and profit.
The backdrop for the rest of this analysis is that Alphabet is in a relatively unusual position. It has the balance sheet and profit engine to fund a massive infrastructure cycle, and it has a cloud business that is large enough – and improving enough – to be taken seriously as part of the AI ROI story.
IaaS + PaaS – Google’s Share Gains Are Legit, Even If the Leaders Are Still Larger
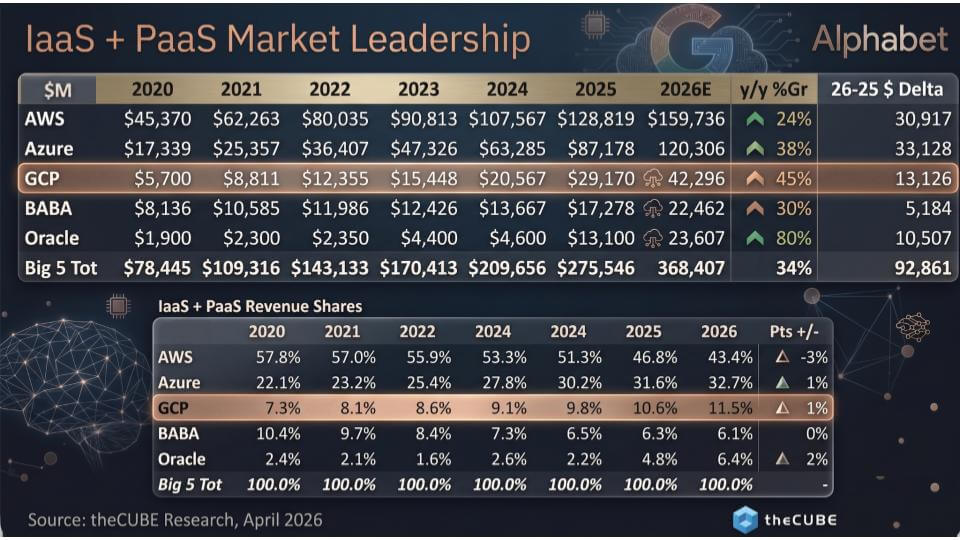
Let’s drill down and key on IaaS and PaaS so we can do a cleaner apples-to-apples comparison across the hyperscalers. The chart below is theCUBE Research market model for the big five in infrastructure cloud – AWS, Azure, Google Cloud Platform, Alibaba, and Oracle.
Two caveats are worth stating up front. First, Google does not break out GCP revenue the way AWS does, and Microsoft’s definitions around Azure have historically moved around. So we triangulate – using company disclosures where available, plus our own survey work and ETR data to build an IaaS/PaaS view that is comparable across providers. Second, this is intentionally infrastructure cloud only. It does not include productivity apps or other adjacent software portfolios that can distort margin and growth comparisons.
With that context, the key point is that GCP is now a $42B IaaS/PaaS business in our 2026 estimate and is growing in the mid-40% range. That’s a big move from where it was in 2020, when GCP was a mid–single digit billion-dollar business by our model. Google is still well behind the two leaders in absolute dollars – AWS projected at roughly $160B and Azure at roughly $120B in 2026 – and that size means both AWS and Microsoft are throwing off enormous annual revenue increments. The delta in the rightmost column quantifies this point as AWS and Azure are each adding on the order of $31B–$33B of incremental revenue from 2025 to 2026, while GCP adds roughly $13B. That $13B annual incremental revenue is still a big number – but the two leaders remain hard to catch because of the size of the installed base.
Where Google is starting to show some progress is share. In our model, GCP’s IaaS/PaaS share rises to about 11.5% in 2026, up roughly a point year over year. One point doesn’t sound like much but in a $370B market it’s meaningful. AWS continues to lead but is now a share donor – down to roughly 43% in 2026 (of the Big 5) – while Azure continues to gain, moving to roughly 33%. The share shift is slow, but it’s been steady.
Oracle is the other notable company on this chart, largely because it is growing off a smaller base at a very high rate and has been aggressive in scaling capacity. The company has projected confidence in demand for its highly available AI infrastructure. The markets are so large that credible platforms can grow quickly, even if the leaders remain dominant.
The takeaway on Google is that the company’s patient capital – its infrastructure discipline, its silicon strategy, and its AI posture – is starting to translate into measurable IaaS/PaaS momentum. It’s still the third player in a market where the top two are enormous, but the growth rate and incremental revenue are now large enough that share gains show up in the data and are meaningful.
ETR Spend Momentum – Google Net Score Holds in the High 30s; Lags AWS and Azure but Account Penetration Steadily Improves
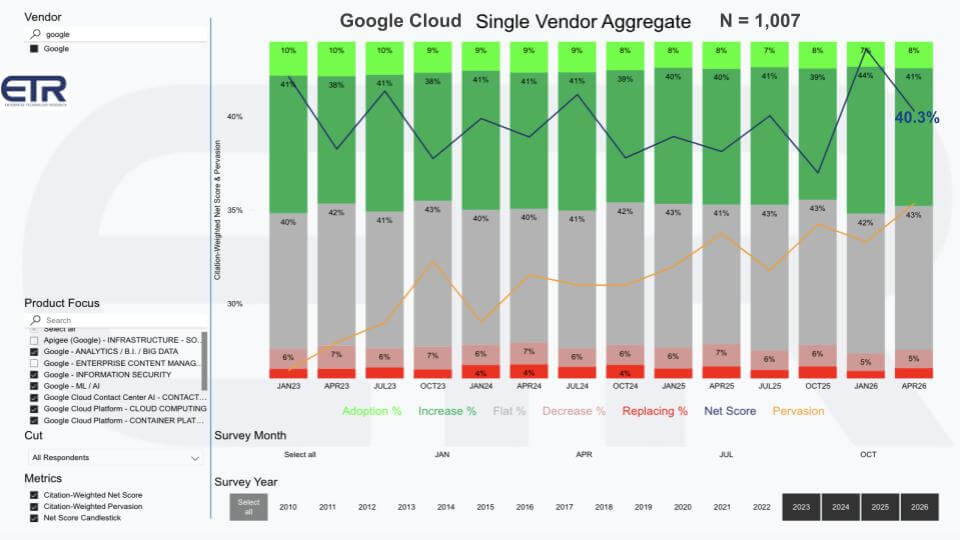
Let’s look at Google Cloud through the perspective of ETR spending momentum. This is one of our favorite charts ETR publishes because it shows not just an overall score, but the underlying mix of customer intent and behavior.
A quick refresher on how to read it. The lime green at the top represents new adoption – e.g. new accounts. For Google Cloud, that’s been running in the high single digits, which is typical for an established platform. The forest green bar represents customers planning to increase spend by 6% or more. In the most recent survey, that’s roughly 41% of the sample. The gray represents flat spend – plus or minus 5% – and that’s running around 43%. The pink is spend down 6% or more, and the red is churn.
Net Score is the “greens minus reds” (the blue line) and is a measure of spending momentum. Net Score is about 40% for this Google Cloud cut, filtered on key services that substantially match AWS reported revenue. Anything above 40% is considered highly elevated so that’s a very strong number and it places Google Cloud in the “high momentum” zone. The other important line is pervasion (yellow), which is a proxy for penetration across the ETR sample. That has been trending up steadily since early 2023, which aligns with the broader post-ChatGPT tailwinds and Google’s improved commercial execution.
A couple of points stand out as follows:
The mix is healthy with a meaningful percent of customers indicated “spending up;”
Churn is low;
Flat spend remains the biggest bucket – which is what one would expect as a platform reaches scale;
Google’s momentum is being driven less by new logos and more by expansion in the installed base, which is where durable cloud growth comes from.
For this view, the product set is intentionally broad but still focused on cloud infrastructure and platform services – analytics and data, security, machine learning, core platform, containers, and related cloud services. The sample size is roughly 1,000 customers, so it’s statistically meaningful, and it gives us a solid way to track whether Google’s AI marketing narrative translates into real budget behavior.
The takeaway is that Google Cloud’s spend momentum has been holding close to the forty percent mark for some time, while its penetration continues to grind higher. That supports our argument that Google is not just talking about AI driving its cloud momentum, it is converting that position into expanding account share in the enterprise.
Google’s Peer Position is Strong, but Still Lags the Leaders
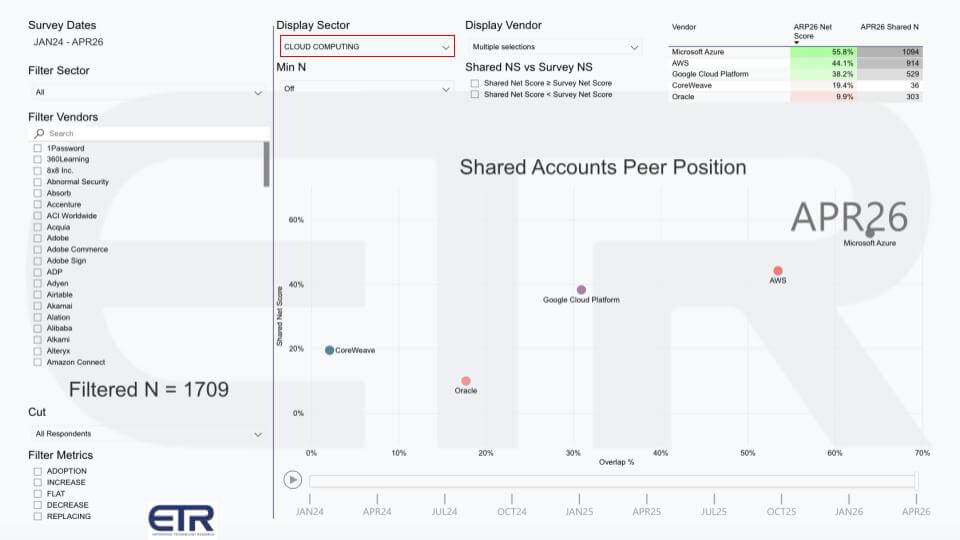
This next ETR view puts Google Cloud’s position in context by plotting two variables. The vertical axis is Shared Net Score – ETR’s spending momentum metric across accounts within the cloud computing sector. The horizontal axis is overlap, which is essentially a penetration proxy – how broadly each vendor shows up across the shared account set. In this view, the filtered N is 1,709 accounts, and the chart is focused on the cloud computing sector for April 2026.
Starting with the numbers in the upper right, Google Cloud Platform’s Net Score is 38.2% with a shared N of 529. That’s a strong number and just under the “highly elevated” 40% level that we often uses as a highly elevated marker. Impressively, Microsoft Azure is at 55.8% with an N of 1,094, and AWS is at 44.1% with an N of 914. Those two vendors are not only posting higher Net Scores, they are doing it at significantly greater penetration, which is why they sit to the right and higher on the chart.
Google’s position is nuanced. The company is clearly in the upper tier on momentum, but it remains meaningfully behind AWS and Azure in account overlap and sample presence. That is a quantitative expression of what the market feels anecdotally – i.e. that Google is winning more business and expanding in accounts, but it is still catching up from a penetration standpoint because the top two are so deeply embedded across enterprise IT estates.
The contrast with the next tier down is also useful. Oracle shows a Shared Net Score of 9.9% with an N of 303, and CoreWeave shows 19.4% on an N of 36. Those figures don’t imply those vendors are unimportant – they simply show that, within this broad cloud computing peer set, the spending momentum and penetration are still concentrated heavily in the big three. Importantly, this is an account-based metric and provides no indication of revenue size.
We note two important points relative to the Google story as follows:
Google’s cloud momentum is real and holding in the high 30s in this view, which leads us to the premise we’ll explore shortly, that Google’s AI chops translate into enterprise spend behavior.
Second, the battle is still as much about breadth as it is about growth rate. Google can grow fast and still struggle to “move the dots” on penetration because AWS and Azure continue to add massive incremental revenue and remain pervasive across the account base.
AI tailwind in the data – Google’s ML/AI spend momentum is the Big Story
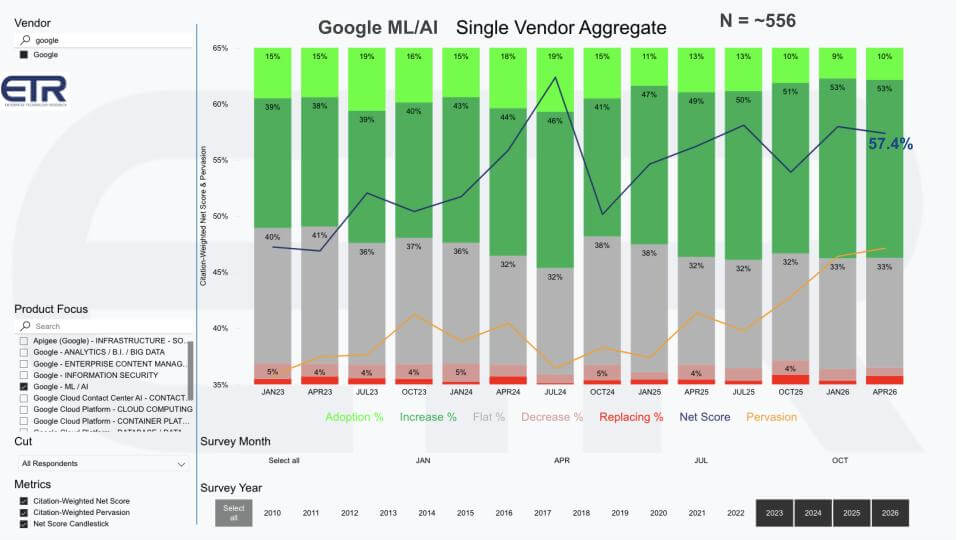
The chart below gets to the heart of the matter – the AI tailwind that is powering Google more broadly and Google Cloud specifically. The data is the same ETR Net Score metric shown as the earlier cloud view, but here we isolate Google’s Machine Learning / AI segment. When we do that, the spend momentum strengthens materially.
The mix tells the story. New adoption (lime green) is running around 10%, up from the prior cloud cloud view. Expansion is a main driver. The “spending up 6% or more” cohort (forest green) jumps to 53% of the sample, while “flat spend” declines to 33%. The red buckets are small – spend down and churn remain low in this cut.
Net Score is again, the greens minus the reds, and in this ML/AI view the Net Score comes in at a very impressive 57.4%. Anything north of 40% is considered highly elevated in ETR’s Net Score data, so this is not a small improvement – it’s a strong statement about where spend momentum exists.
The other key data point above is pervasion (yellow line), which rises sharply over the period shown. That indicates the ML/AI footprint is spreading across the account base – not just confined to a handful of early adopters. Said differently, Google’s AI business is not only growing – it is broadening.
The takeaway is that AI is not just a marketing narrative for Google – it is showing up in the survey data as tangible spending momentum. Our premise has been that the ML/AI segment is pulling Google’s broader cloud business forward, and it helps explain why Google’s cloud performance has improved so meaningfully over the last two years.
In ML/AI Google shows top tier spend momentum, with broad penetration
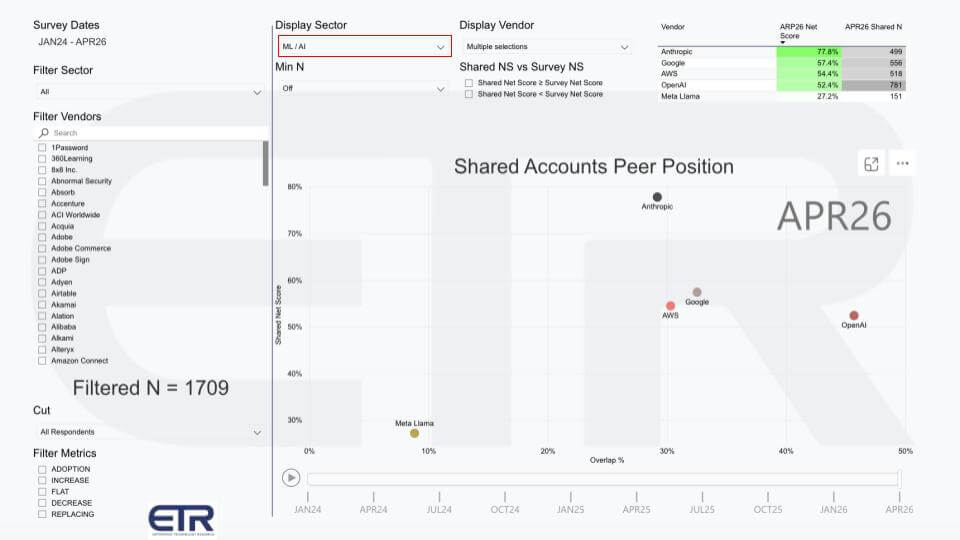
Let’s take the same shared accounts XY view and isolate it on ML/AI rather than cloud computing broadly. The axes are the same – Net Score on the vertical and Overlap on the horizontal, which is an account penetration proxy into the dataset. In this cut, the filtered N is 1,709 accounts, and the chart reflects the April ’26 snapshot.
Start with the numbers in the upper right. Google posts a Shared Net Score of 57.4% with a shared N of 556. That is a highly elevated spending momentum signal, and it’s notable that Google’s shared N in ML/AI is effectively the same magnitude as its presence in the prior cloud computing view. The implication is that when enterprises are making AI decisions, Google shows up in a large portion of the same accounts where cloud budgets are being allocated. That helps explain why AI momentum translates into cloud momentum – the adoption path runs through the platform.
The peer comparison is also useful. Anthropic is at 77.8% on a shared N of 499, which is exceptional momentum and reflects how quickly it has moved into the enterprise. AWS is at 54.4% on 518, much of that likely comprises Anthropic sell through. OpenAI is at 52.4% on 781. OpenAI is a useful proxy for the broader Microsoft AI footprint given how inference consumption often flows through Azure. We purposely left Microsoft off the chart to minimize the noise due to the company’s ubiquity.
Two additional observations stand out as follows:
This view shows that the AI spend is being driven by a relatively small set of vendors with strong enterprise pull – and Google is clearly in that top cohort;
Google is the only hyperscaler with a frontier model in the class of OpenAI and Anthropic;
Meta Llama is materially lower at 27.2% with a shared N of 151, which suggests that while open models remain important, the enterprise spending velocity is moving fastest where capability, distribution, and operationalization are strongest. Notably, Llama’s position has gone from leading to laggard in short timeframe.
The takeaway is that Google’s AI position is not opaque. It shows up in customer spending momentum at a level that is comparable to the most important peers in the market, and with broad enough penetration to act as a growth driver for the broader Google Cloud business. With a full stack story, from TPUs, infrastructure, security, models and applications, our view is Google has sustainable competitive advantage.
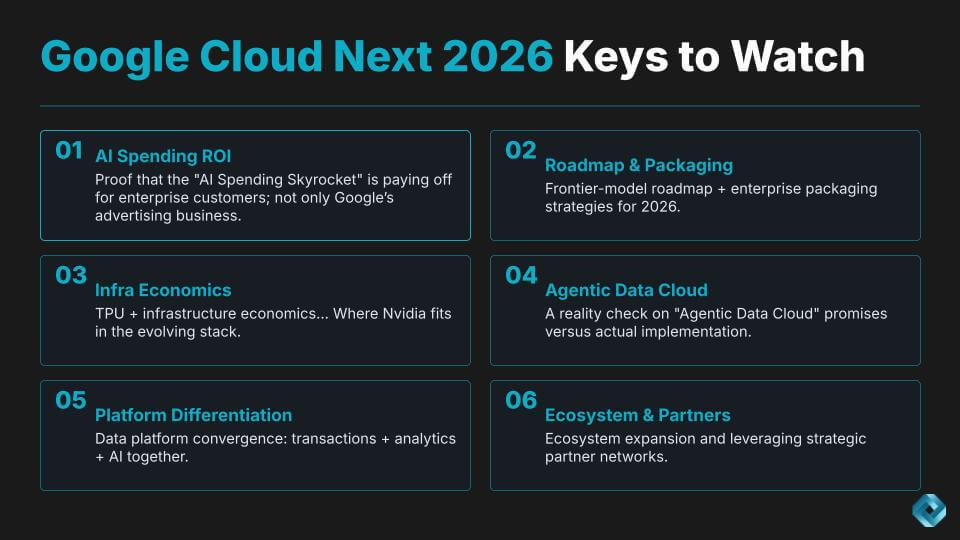
Google Cloud Next 2026 – Six Things We’re Watching
To close, here are the things we’re watching at Google Cloud Next this week.
Enterprise AI ROI – we want proof that this AI capex skyrocket is paying off for enterprisecustomers, not just Google’s advertising business. Alphabet’s capex ramp has been dramatic, and investors have been tolerant. That tolerance lasts if customers can point to measurable returns – productivity, lower unit costs, better throughput, faster time to deploy real workloads. We’ll be looking for evidence that the economics are improving for customers, not just for Google’s main business.
Frontier Model Roadmap – we want clarity on the frontier model roadmap and how it’s being packaged for enterprises. What’s new in Gemini, Vertex and related models that actually changes adoption? Tool use and reasoning are critical, but what’s even more interesting is what comes out of the box to simplify enterprise adoption – e.g. governance controls, deployment blueprints, evaluation, and reference implementations that don’t require a thousand-engineer build-out to get to production.
TPU and Infra Economics – we want to understand the TPU roadmap in practical terms – cost/performance, cost per watt, availability, networking, inference efficiency – and where NVIDIA fits in Google’s plans. Google is building its own silicon franchise, but it also acknowledges the NVIDIA relationship. The market is moving toward performance-per-watt as a gating metric, and the winners will be the ones that can optimize end-to-end workload economics at scale – training and inference – without relying on headline benchmarks.
Fourth – a reality check on the agentic data cloud premise. We want to see whether Google can deliver closed-loop systems that tie signal to decision to action, in real time, without turning data movement and governance into an expensive process. Semantic context, data harmonization, real-time activation, unified policy controls, and less glue work – all to power enterprise agents at scale. These are the difficult tasks for enterprises that we want to hear how Google is simplifying.
Platform Differentiation – in the data layer, specifically the integration of transactions and analytics with AI. We want to see tighter alignment across BigQuery, transactional engines like Spanner and AlloyDB, and Vertex so that AI systems can act on live business data, not just historical analytic data. The indicator here is whether Google is reducing the integration burden – unified metadata, policy, lineage, and consistent access controls across data types.
Ecosystem and Partners – partner leverage has been a major contributor to AWS’s momentum for years. Google’s AI strength should translate into ecosystem momentum – more partners building, more repeatable solutions, more field affinity. We’ll be watching how Google is enabling that and whether it shows up in customer proof points.
We’ll be at Next this week – John Furrier and the team will be there with theCUBE, and George Gilbert will be on the ground doing deep technical sessions. George and this author will publish a Breaking Analysis later in the week combining what he hears from engineers and technical leaders with what we pick up in the analyst program.
All statements made regarding companies or securities are strictly beliefs, points of view and opinions held by SiliconANGLE Media, Enterprise Technology Research, other guests on theCUBE and guest writers. Such statements are not recommendations by these individuals to buy, sell or hold any security. The content presented does not constitute investment advice and should not be used as the basis for any investment decision. You and only you are responsible for your investment decisions.
Disclosure: Many of the companies cited in Breaking Analysis are sponsors of theCUBE and/or clients of Wikibon. None of these firms or other companies have any editorial control over or advanced viewing of what’s published in Breaking Analysis.
David Vellante
David Vellante is co-CEO of SiliconANGLE Media, as well as co-founder and Chief Analyst at theCUBE Research, the world’s leading open source technology research community.
Dave is a long-time tech industry analyst, entrepreneur, writer and speaker. As co-host of theCUBE – “The ESPN of Tech,” Vellante has interviewed over 5,000 experts since 2010. He is also a co-founder of CrowdChat, an angel funded startup based in Palo Alto using big data techniques to extract business value from social data.
Prior to these exploits, Dave founded a CIO consultancy and spent a decade growing and managing IDC’s largest business unit. He lives in Massachusetts with his wife and four children where he is active in town activities including serving as the president of his town’s local “Kiddie Sports” association. Dave holds a B.S. in Applied Mathematics from Union College.