Recent spending intentions data from more than 1,700 IT decision makers indicates that executives expect technology budgets to grow at 4.3% this year. That’s up from roughly 3.5% in 2023 and is higher than the expectation in October which was 3.8%. But the forecasts for 2024 are backend loaded. Moreover, while some sectors such as energy and regions like APAC expect higher growth, many of the largest companies and big spenders plan to grow below the mean. The good news is that full year 2023 spending came in higher than expected, indicating a strong finish to the year.
Looking ahead, forty percent of organizations report that generative AI funding is stealing from other budgets. We feel that AI must deliver tangible ROI in order for spending to show sustained strong growth this year and beyond. While we’re cautiously optimistic, without an AI boost, it’s likely that macro spending will continue to be dependent on the Fed’s moves.
In this Breaking Analysis we unpack the ETR January spending data, dig into those areas that are expected to show above average performance and those that are likely to lag.
Encouraging Reversal in Spending Expectations
Let’s start by looking at the changing expectations going back to the pandemic’s high. The chart below shows the expected annual growth rate at different points in time for 2022 and 2023.
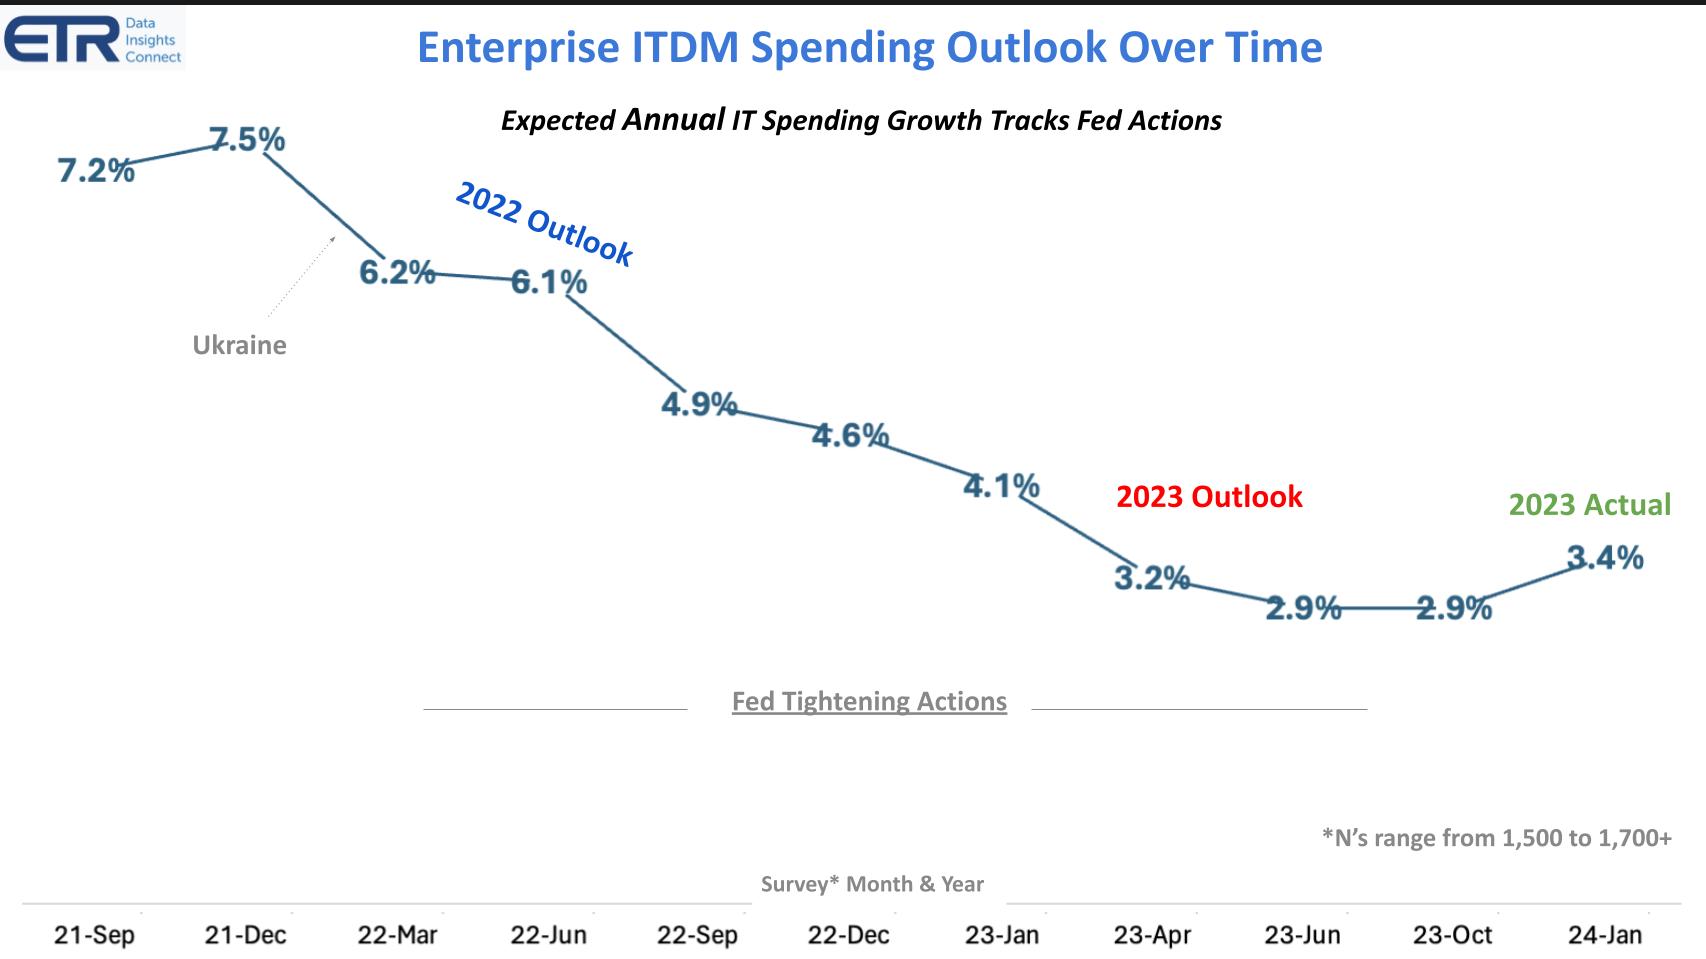
In late 2021 and entering 2022, ZIRP – zero interest rate policy – was still in full swing as was the technology spending boom. The war in Ukraine coincided with a downward revision in expectations and we saw the deceleration continue through the summer of last year when the Fed stopped tightening.
Expectations for full year 2023 remained tepid at 2.9% in the October 2023 survey, but the checkpoint in January shows that spending actually came in higher for the year at 3.4%, indicating a strong finish. Moreover, expectations for 2024 are coming in at 4.3% growth. The first note of caution however is they are back loaded.
Spending Expectations are ‘Stubbornly Positive’ for 2024
Let’s look at this data in more detail. The ETR data below shows the IT spending estimate for the specified periods. The gray bars are from the July 2023 survey, the blue represent October and the yellow bars show the most recent January survey.
Starting at the right, we see IT spending last October was forecast for the full year 2024 to grow 3.8% and jumps to 4.3% in the January survey. That’s the green arrow and shows a positive upward revision.
As we said above, it appears 2023 actuals came in at 3.4%, above the October forecast of 2.9%, indicating yearend strength, possible budget flushing and/or momentum from the yearend market rally.
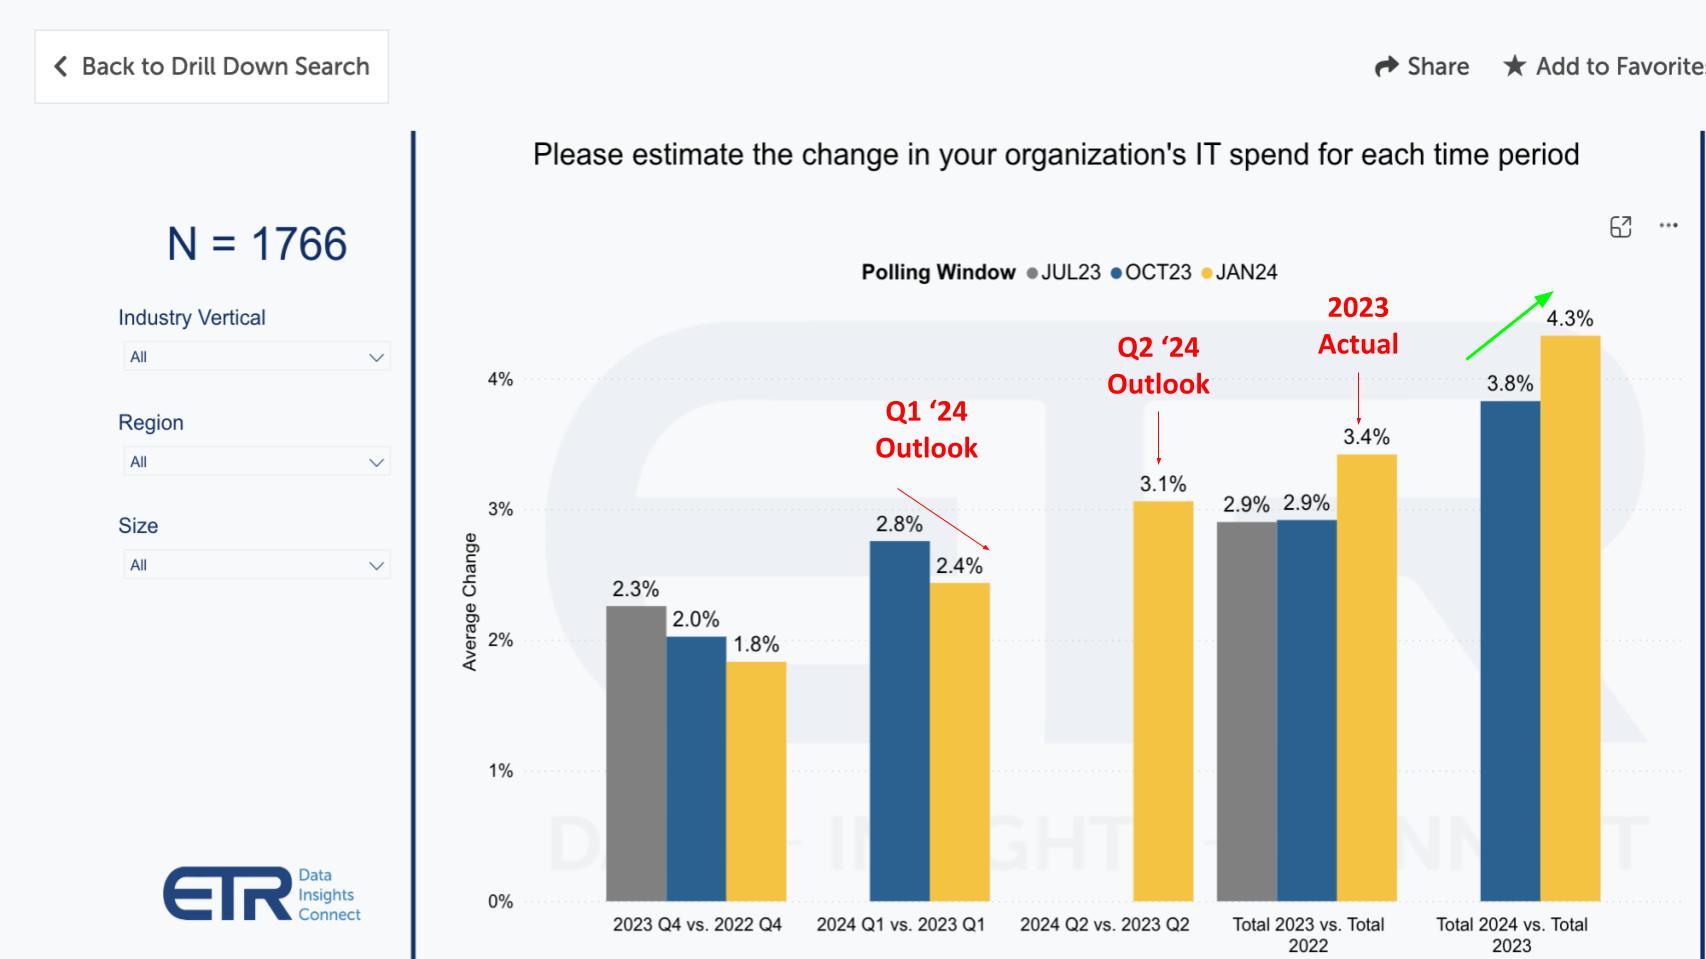
Somewhat concerning however is, jumping to the second set of bars from the left, we see Q1 2024 forecasts at 2.4%, down from the October ’23 survey’s expectations for Q1 ’24. From there, moving to the Q2 ’24 outlook we see it comes in at 3.1%, below the 4.3% expectation for the full year. This is an indication that the optimism is back loaded to the second half and will be dependent on how companies are performing. We often repeat the sentiment of AWS CEO Adam Selipsky that we’ve seen worse times and better times but never more uncertain times. And that applies here.
Sectors Performing Above and Below the Mean
Further double clicking on this data, let’s look at some of the sectors that are performing above or below the average.
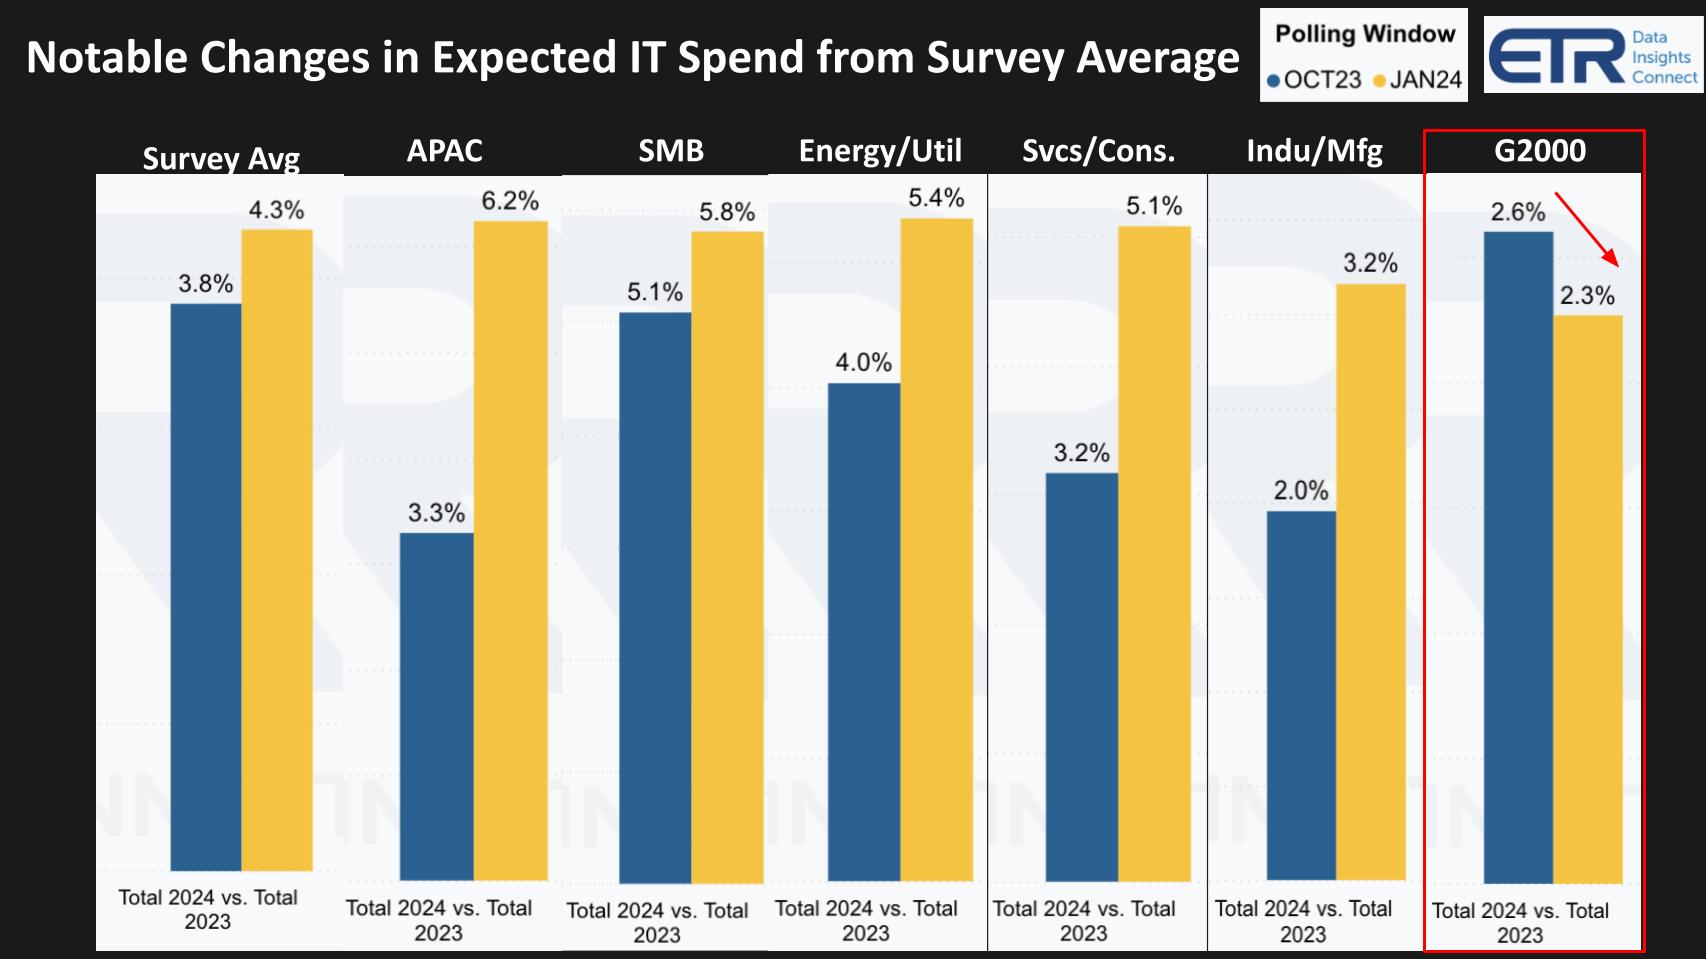
This ETR data shows the forecast from October (the blue bars) and the most recent January survey (yellow bars). Here are the key points of focus:
- The average for 2024 spending is for 4.3% growth.
- Note the significant uptick in Asia/Pacific jumping to 6.2%.
- SMB remains above average at 5.8%.
- The energy/utilities sector is showing a strong bump up to 5.4%.
- Services/consulting Jumps up to 5.1%.
But two key sectors are showing softness:
- Manufacturing / industrial jumps from October, which is both a positive but is also a negative because it’s below the average.
- More concerning is Global 2000 shows a deceleration in both expectations from October and, at 2.3%, well below the 4.3% survey average.
Methods of Decreasing Spend
This next chart looks into those organizations indicating a spend decrease to understand how they expect to cut.
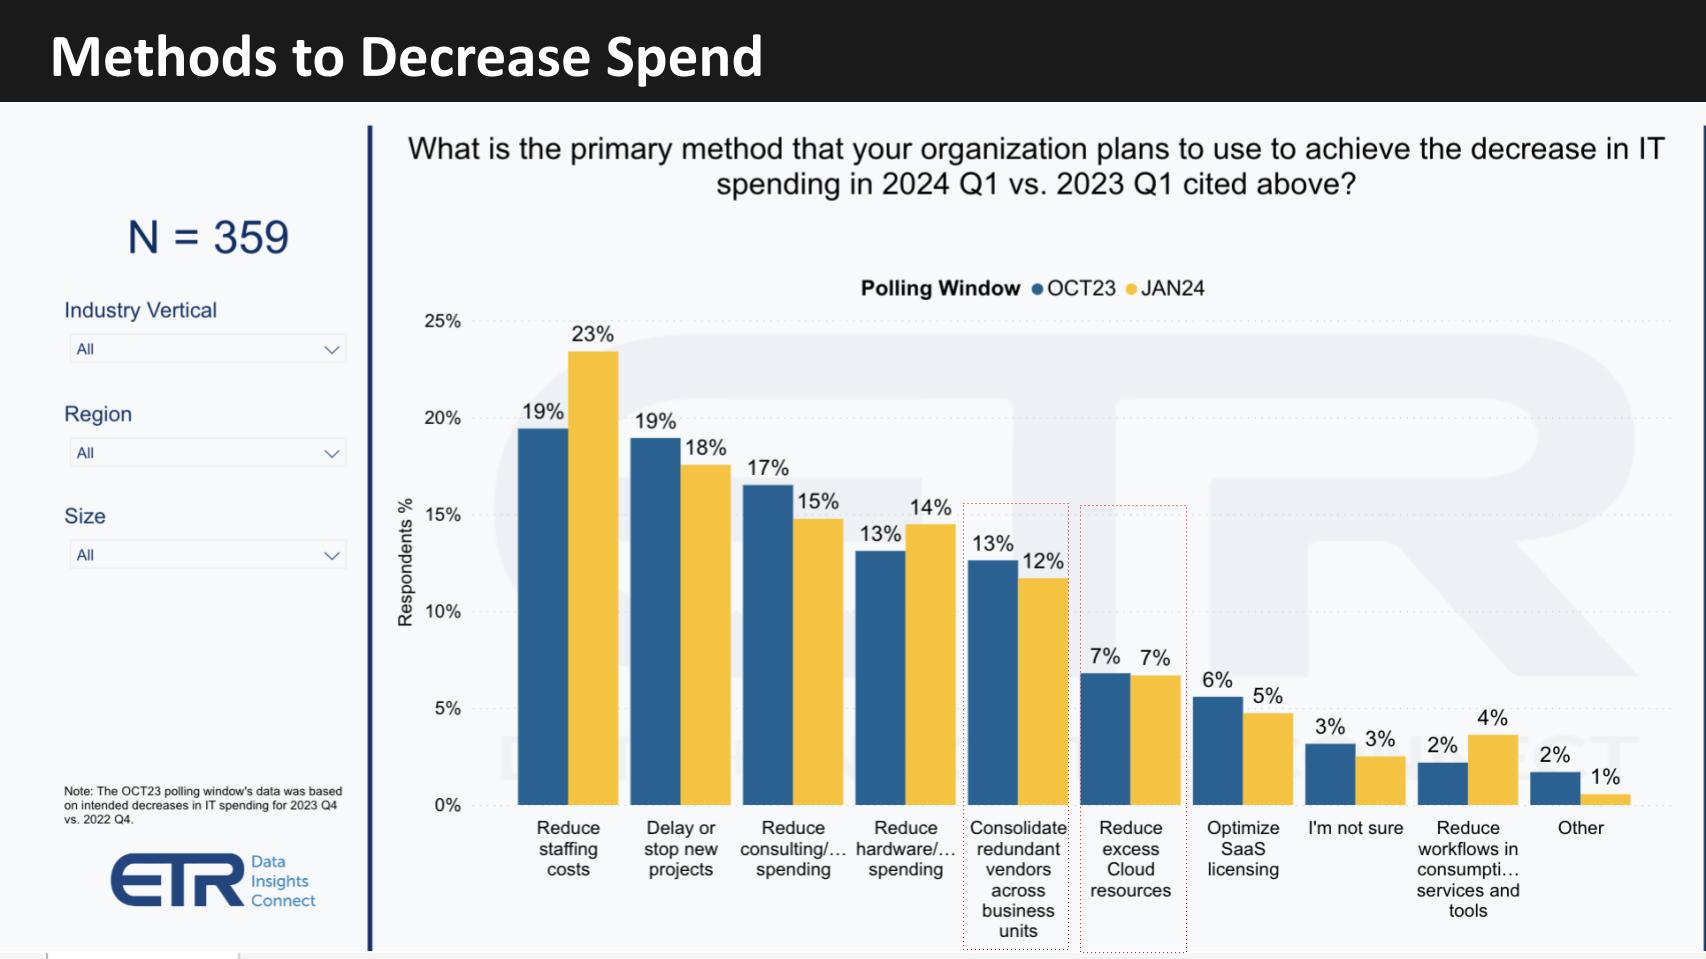
Here are the key points:
- Reduced staffing is now the top response at 23%.
- Project freezes and reduced outside consulting spend fall in right behind.
- Squeezing the hardware budget ticks up a point.
- Consolidating redundant vendors and reducing excess cloud spend come next but are much less prominent than in previous surveys.
We’ve highlighted those two in red because they were notably higher a year ago at 36% and 19% respectively. Most organizations have not messed with their SaaS licenses because SaaS is very sticky and ripping out software that connects to business processes is disruptive.
Consolidating Redundant Vendors & Cloud Optimization are Less Prominent Methods of Cutting
Digging into those two highlighted areas from the earlier chart we see the data below shows the results from January 2023 compared to January 2024. Note that consolidating redundant vendors was the number one method a year ago and has dropped from 36% of customers citing that approach to 12%. So while there may be some juice left to squeeze in that lemon it seems we’re coming to the tail end of that opportunity. We don’t have this data by sector but we’ll be looking to see if the consolidators in security, namely CrowdStrike, Palo Alto Networks and Zscaler can continue to capitalize on the consolidation trend in cyber. Given the enormous tools diversity this may be one sector that is immune from the drop in this method.
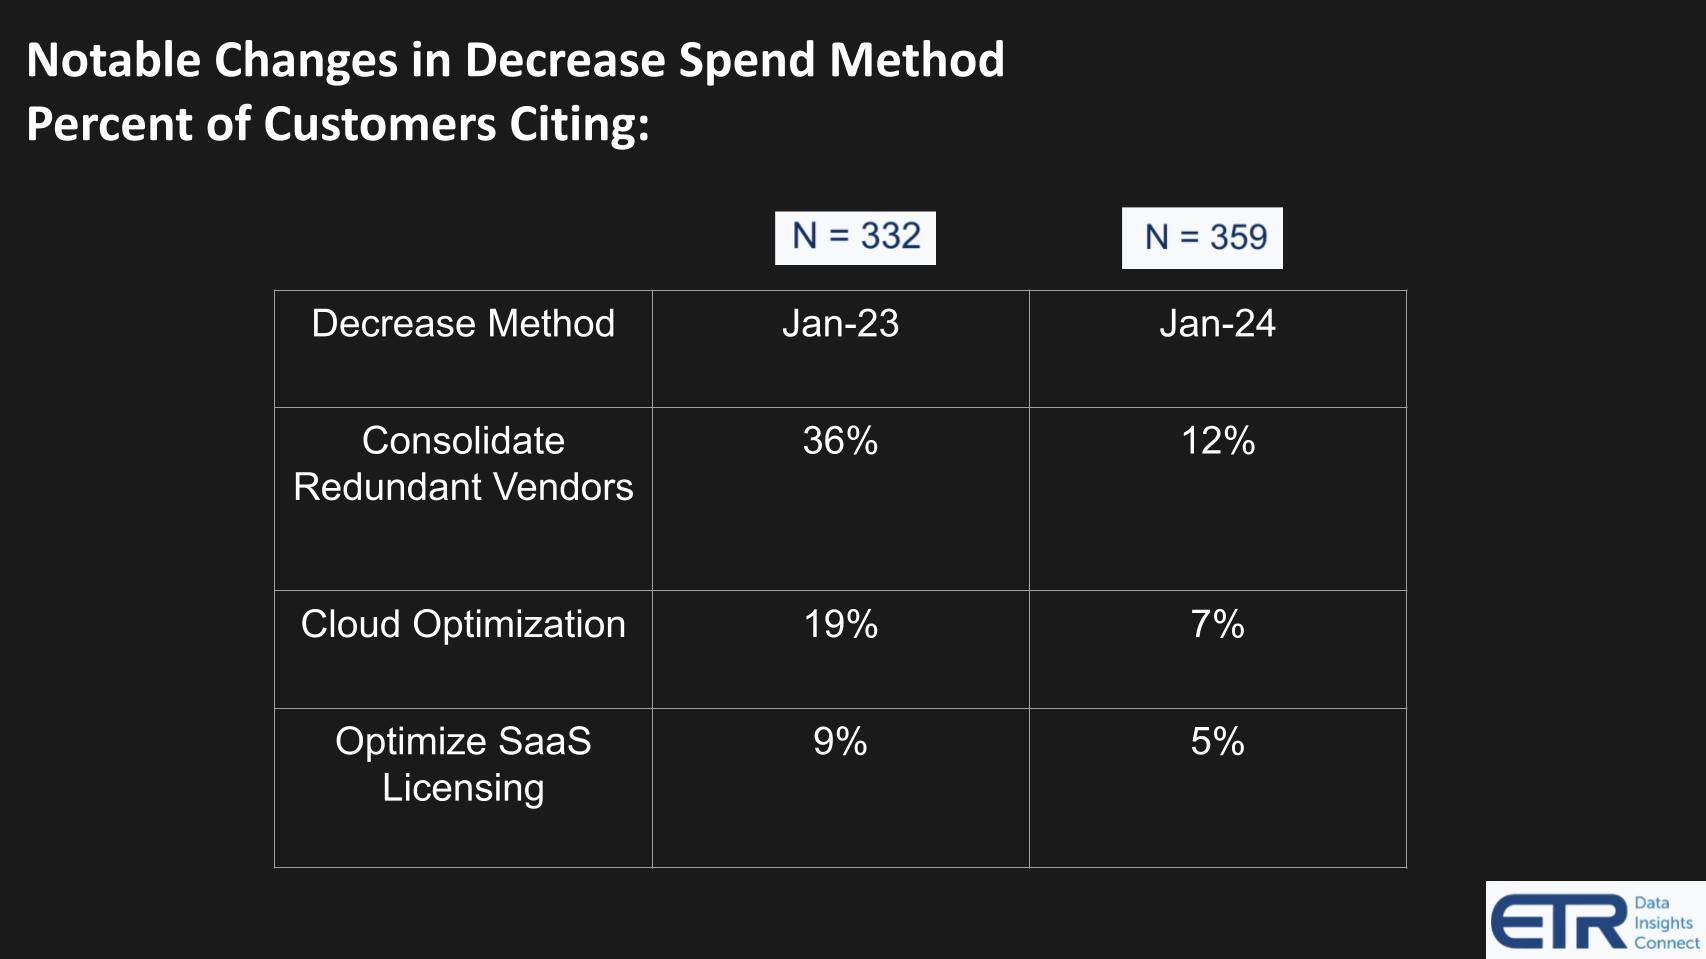
The other callout here is cloud optimization, which has been a major theme since pandemic’s peak cloud momentum. It seems this approach is settling as cloud remains the platform of choice for new application deployment and innovation.
As we said earlier, while there are some opportunities for customers, SaaS license optimization was never a major factor and is even less so in today’s climate.
AI Retains the #1 Sector Momentum, Above all Others
We’re going to show two more big picture data points before we wrap. This data below shows Net Score on the vertical axis, which is a measure of spending velocity, and presence in the survey of 1,700+ for each sector. The red line at 40% indicates a highly elevated Net Score. Throughout the pandemic, AI, containers, cloud and RPA sustained above that line. AI was on a deceleration pattern until ChatGPT was announced in late 2022 and then began a steady climb, impacting its automation cousin RPA. Cloud and containers have been persistent and are holding serve.
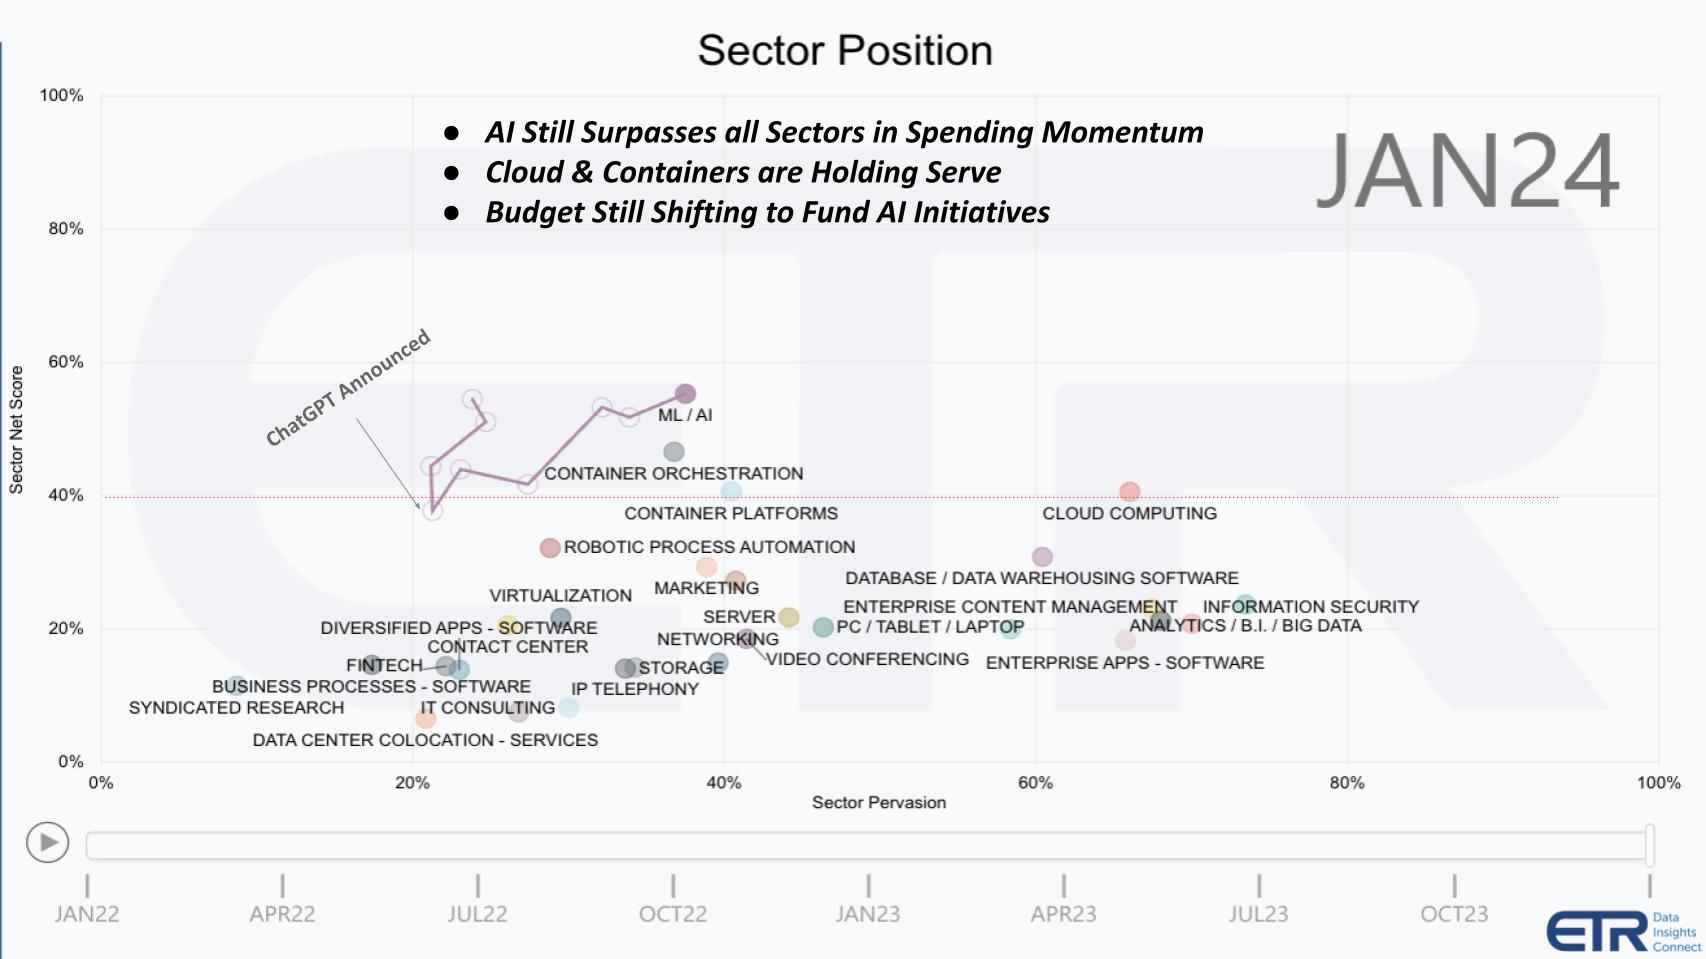
To the last point, we continue to interpret the data that AI’s rise is serving to somewhat dampen other sectors. Not just the obvious challenges with legacy RPA technologies that haven’t evolved, but all sectors with some exceptions such as security and data.
Swaths of Budget are Reallocating into Generative AI
This next chart underscores the last point.
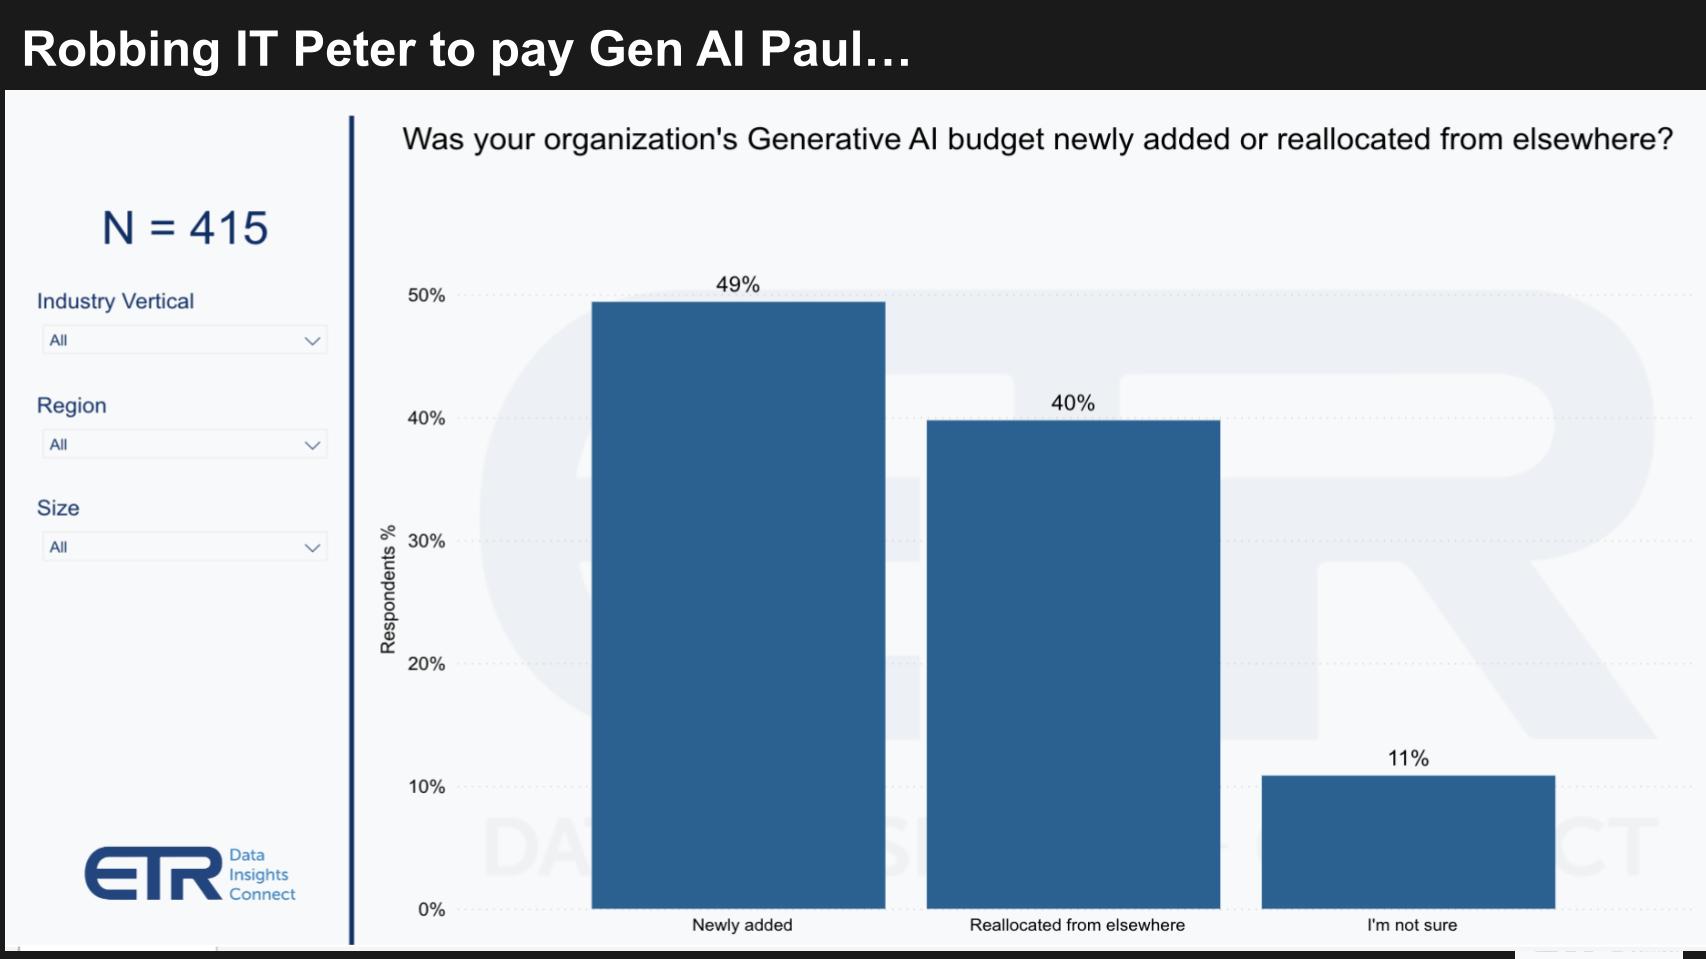
This drilldown data above has 415 respondents and shows that 40% of them are funding AI by reallocating from other budgets. While nearly half is fresh funding, a big chunk is coming from other budgets. Notably, while we don’t show it here, this is most acute in the larger firms and much less a factor in smaller businesses, privately held companies and APAC. But as you know the big public companies are also big spenders so we believe this is having an impact on the overall market.
Key Spending Takeaways to Watch
- The data shows IT decision makers expect a 4.3% increase in spending this year, breaking a seven quarter deceleration trend.
- That optimism is very much back loaded into the second half of 2024, indicating visibility remains murky and mixed for many companies.
- Certain sectors like energy and services expect to grow above the mean. As do customers in Asia Pacific and SMB.
- But the all important Global 2000 is expecting spending deceleration and growth two percentage points below the mean.
In addition, methods to reduce cost are shifting. No longer are consolidating redundant vendors and cloud optimization two of the more prominent techniques. Rather staff reductions, project delays and limiting outside consulting spend are taking over the top spots. Perhaps the first being a function of AI deployments.
However the data still suggests AI spend is stealing from other sector budgets with 40% of customers indicating such.
The bottom line is 2023 was the year of AI experimentation and in order to see more sustained and accelerated growth, 2024 has to be the year of AI ROI.
Keep in Touch
Thanks to Alex Myerson and Ken Shifman on production, podcasts and media workflows for Breaking Analysis. Special thanks to Kristen Martin and Cheryl Knight who help us keep our community informed and get the word out. And to Rob Hof, our EiC at SiliconANGLE.
Remember we publish each week on Wikibon and SiliconANGLE. These episodes are all available as podcasts wherever you listen.
Email david.vellante@siliconangle.com | DM @dvellante on Twitter | Comment on our LinkedIn posts.
Also, check out this ETR Tutorial we created, which explains the spending methodology in more detail.
Watch the full video analysis:
Note: ETR is a separate company from Wikibon and SiliconANGLE. If you would like to cite or republish any of the company’s data, or inquire about its services, please contact ETR at legal@etr.ai.
All statements made regarding companies or securities are strictly beliefs, points of view and opinions held by SiliconANGLE Media, Enterprise Technology Research, other guests on theCUBE and guest writers. Such statements are not recommendations by these individuals to buy, sell or hold any security. The content presented does not constitute investment advice and should not be used as the basis for any investment decision. You and only you are responsible for your investment decisions.
Disclosure: Many of the companies cited in Breaking Analysis are sponsors of theCUBE and/or clients of Wikibon. None of these firms or other companies have any editorial control over or advanced viewing of what’s published in Breaking Analysis.