Despite softer tech spending, cloud revenue shows continued momentum into 2021.
As we watch an historic election unfold before our eyes, we look back at the early days of this millennium and the memorable presidential race of 2000. That decade was defined by 9/11, which permanently re-shaped our thinking. We exited the ’00s at the tail end of a massive financial crisis only to enter the 2010’s with hope, and the momentum of fiscal stimulus, a flat globe, job growth and very importantly, the ascendency of the cloud. Cloud computing, unquestionably powered the innovation engine over the last ten years and the pandemic marks a new era, where adoption of cloud, data and AI have been accelerated by two to three years.. These trends will shape the future of the technology industry and all businesses.
In this Breaking Analysis we’ll update you on our latest cloud market share data and dig into some fresh October survey data from our partners at ETR.
Cloud Trends Eight Months in to COVID
Interestingly, each of the big 3 cloud players showed nearly identical year on year growth rates in Q3 relative to Q2. We’ll dig into that more in a moment but our data suggests that these three companies combined will account for more than $75B in IaaS and PaaS revenue this year and are potentially on track to hit $100B in 2021.
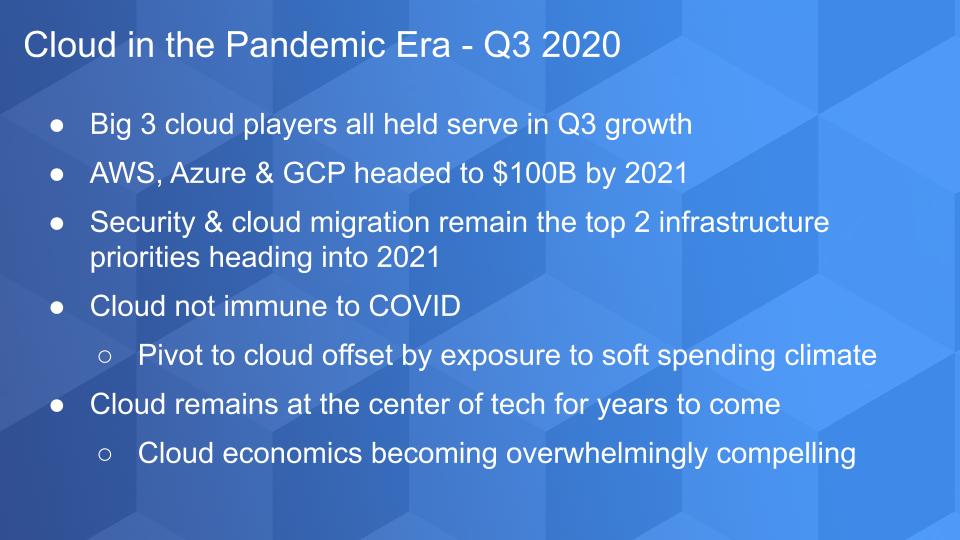
Customer survey data indicates that CIOs top two infrastructure priorities remain security and cloud migration.
That said, as we’ve previously reported, the cloud is not immune to the pandemic. The remote worker pivot, while a positive hasn’t completely eradicated certain headwinds. What we mean here is that because the cloud vendors are now so large, they are exposed to the softness in IT spending and the industries hardest hit by the pandemic. Would the cloud growth be better if the pandemic didn’t hit? We’ll never know for sure but our data suggests, no. COVID has been a benefactor to cloud.
In our view cloud will remain at the center of technological innovation for the foreseeable future. The economics of cloud are becoming so compelling that we think the power of the big cloud companies will only increase this decade. Importantly we’re talking about the costs of running hyper distributed systems; we’re not commenting here on what cloud players charge customers. We believe the hyperscalers’ cost structure is superior to alternative approaches and we believe this advantage will continue to accelerate. We also believe competition will drive competitive pricing and innovation, although the prospects of a cloud oligopoly could eventually temper our conviction.
Tracking IaaS & PaaS Revenue of the Big 3
The chart below shows our estimates of AWS, Azure and Google Cloud Platform. Readers of Breaking Analysis know that AWS provides clean numbers and Azure and GCP are estimates that we derive based on tidbits of guidance from the companies, survey data from ETR and other information that we analyze from our community.
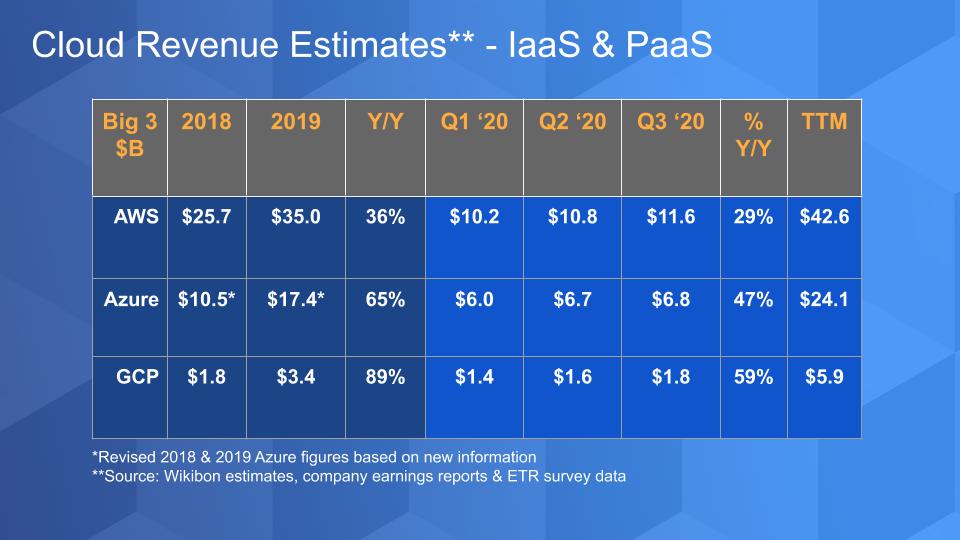
As indicated, we’ll end this year at around $75B in revenue or more for the the big 3. Note that we’ve slightly restated some of our earlier estimates for Azure to reconcile some differences that we had between constant currency and reported growth. We try to keep things in constant currency where possible.
Azure according to our estimates, as we reported last week, is now 18% of Microsoft’s overall revenue number – we estimated that at 19% last week but have toned it down a bit. AWS represents a much smaller percentage of Amazon’s revenue – 12% – but it represents 56% of Amazon’s profits. GCP on the other hand accounts for less than 5% of Google’s overall revenue, which as we stated a few weeks ago needs more attention from Google.
But look at the growth rates for these three platforms and the respective size of their IaaS / PaaS businesses. You hear all this talk about cloud repatriation – i.e. people move to the public cloud but are unhappy or it’s too expensive so they come back on prem – you just don’t see that in the numbers so be careful when a vendor tries to sell you on that trend. I don’t buy it except for selective situations. By the way, hybrid cloud is not repatriation.
Customer Spending Patterns in AWS, Microsoft & Google
The “wheel graphs” below show the breakdown of Net Scores for AWS, Microsoft and Google. One note – these figures represent these three companies’ overall performance within the ETR technology taxonomy, meaning we’re evaluating responses across their entire portfolio. So for example they include all of AWS (they don’t include Amazon’s retail business) and they include Microsoft’s entire tech portfolio – i.e. not just cloud. For context we’ve also added Oracle to show what a mature company’s spending breakdown looks like.
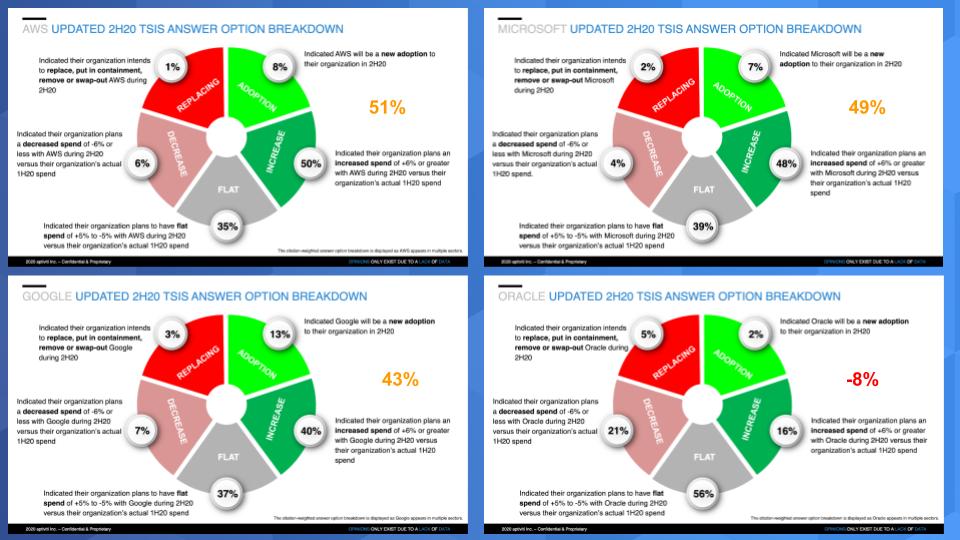
The green portion of the wheel represents increases in spend whereas the red sections show decreases. Net Score is shown in orange (red for Oracle) and is calculated by subtracting the two reds from the greens. In other words, Net Score = (Adoptions + Increase) Minus (Decrease + Replacements).
The takeaway here is these are all strong, with AWS leading the pack. Microsoft is exceptionally strong in our view because the company is so huge and it still has a Net Score comparable to AWS, which has a more focused business. Google is a laggard and is showing softness in the data – despite our sanguine outlook back in 2019. Perhaps Google’s smaller presence muted their customers’ ability to take advantage of the platform when the pandemic hit. The thinking here is customers needed to pivot to the cloud very quickly and AWS and Azure were the most expedient path – hence the higher increases in the “Spend More” category. Whereas GCP required new connection points and processes. But still, Google showed 13% new adoptions which is good and perhaps expected given its smaller size.
Regardless, these are not pure play cloud comparisons but they give a good indication of spending momentum. We would also note that all three show very low defections while each is has solid increases in new adoptions.
Serverless – If we had to do it all Over Again…
Serverless is a strange term and not really accurate, but it has stuck. Serverless computing is a model where the cloud platform dynamically delivers services as the application requires. No need to deploy and configure compute and containers, for example, rather when an application needs resources – it goes and gets them and you only pay for the services that are in use. Serverless is very good for workloads that spin up and spin down frequently.
It’s an increasingly popular model and as we’ll show in a moment – there’s a lot of spending momentum in this area. But before we look at that want to share some comments made by Andy Jassy a while back about serverless. Jassy essentially commented to us on theCUBE, that if Amazon’s retail business had serverless available at the time it was building out, it would have build its platform on Lambda, AWS’ serverless offering. Here’s what he said:
Lambda is Amazon’s serverless offering. And if you think about Amazon’s retail business and take for example the frequent spin up and spin down of resources for something like Black Monday, serverless would be a much more cost effective approach. Same for a managed data warehouse service where you don’t want to pay for the compute if it’s idle. The app just calls for compute when it’s needed.
Spending on Serverless is Red Hot
Serverless is becoming a very popular computing model today with increasing momentum as you can see in the slide below.
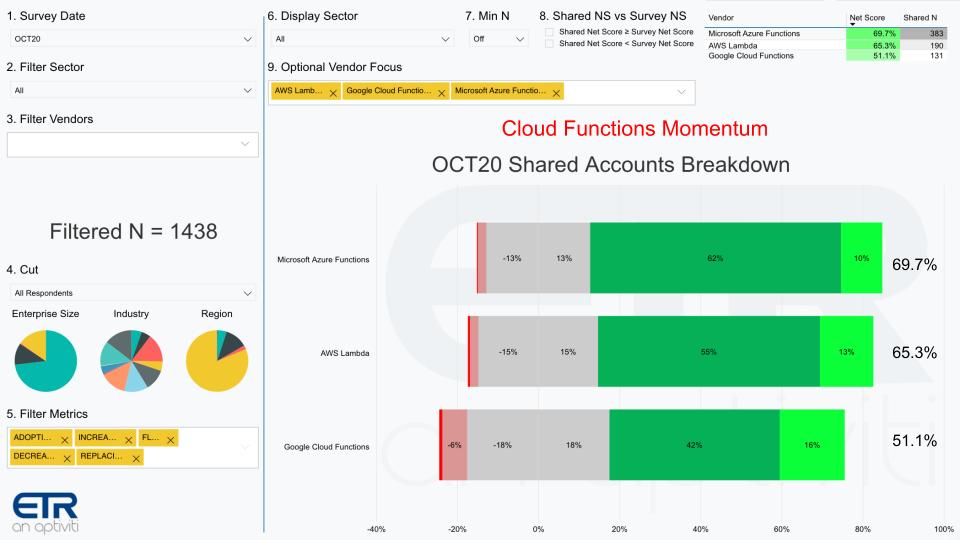
It shows the Net Scores for serverless for Azure, AWS Lambda and Google Cloud Functions. Look at the Net Scores – Azure Functions, nearly 70% with AWS at 65%. Google again is lagging at 51% and it’s a bit of a concern because this is a really hot space.
AWS & Azure Lead, While the Pack Follows
This XY graph below shows Net Score or spending momentum on the vertical axis and Market Share on the horizontal axis. Market Share is a measure of pervasiveness in the ETR data set. In the upper right you see the table that ranks each vendor by Net Score and shows the number of shared accounts for this cut out of the total 1,438 respondents.
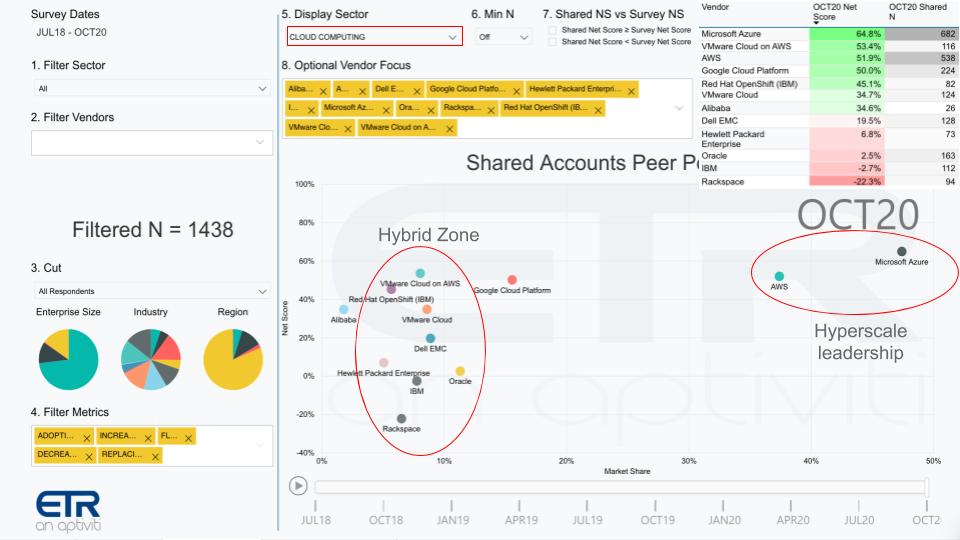
You can see up top in the middle we’ve selected on the Cloud Computing category – so this represents only the cloud businesses for each of these players. There is a bit of nuance here in that we’ve pulled Microsoft Azure specifically from the data and we’re comparing that with AWS overall – so there are things in AWS overall that fit into other parts of the ETR taxonomy like AI and collaboration etc. Whereas Azure and GCP represent just their IaaS businesses. We know it’s a big strange because AWS is all cloud but don’t get caught up in the taxonomical nuance. The point is – it’s good to be Azure and AWS. They stand alone in cloud leadership.
Google Cloud has elevated Net Score levels but just doesn’t have the presence in the market. Now look at that hybrid cloud zone emerging. We’ve shared this previously but we want to call out VMware Cloud on AWS, Red Hat OpenShift and VMware Cloud (i.e. Cloud Foundation, etc.). All of these appear to be gaining traction and you can see the number of occurrences in the upper right in the table – we’re starting to see real numbers that are meaningful. VMware Cloud on AWS for example has a Net Score of 53% with 116 accounts within the total respondent sample. OpenShift – 45% Net Score with 82 accounts – and Red Hat is in beta with what look to be some really strong offerings on AWS.
And you can see for context we’ve added Dell EMC’s cloud offerings, with HPE, Oracle Cloud, IBM and Rackspace. Dell actually looks pretty strong with a Net Score of 20% and 185 shared accounts. Oracle, IBM, Rackspace are not killing it in the survey by any means so we’d like to see the data match the marketing rhetoric with these companies.
And look Alibaba is starting to show in the data – only 26 shared N’s but we thought we’d throw it in.
Three key points: 1) AWS and Microsoft keep on trucking– Google – needs to do better; 2) Hybrid becoming real and eventually that bodes well for multi-cloud; 3) legacy on-prem players have some work to do – still a case where their on-prem decline isn’t being offset by large enough cloud momentum.
Will AWS go up Stack and Compete in SaaS?
There’s a lot of talk again in our community about AWS’ slowing growth rates and whether they will have to enter the SaaS market directly to expand TAM. We’ve said consistently – while we never say never about AWS, we don’t think so – at least not yet.
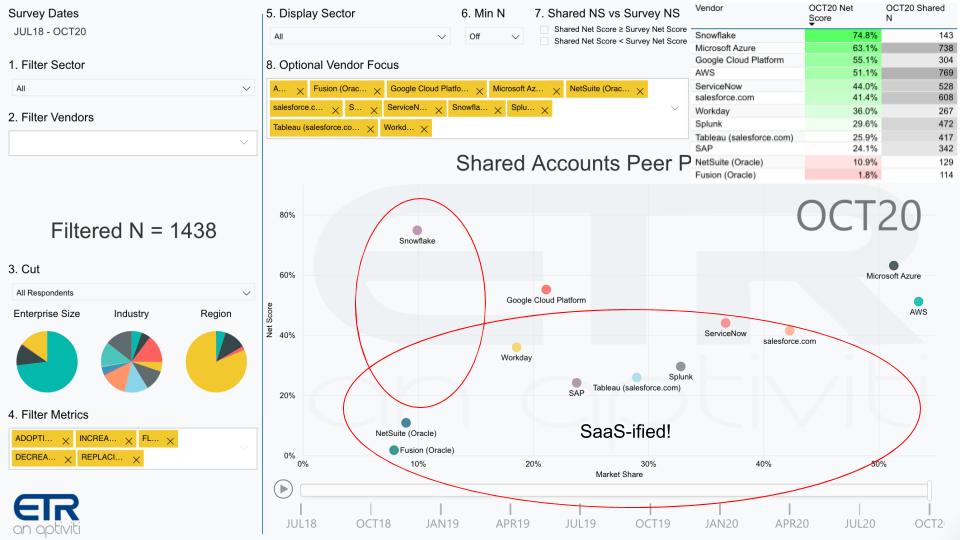
The chart above plots the big three cloud players along with some prominent SaaS platforms and ISVs. Note AWS has a bigger piece of this pie now that we’ve turned off the Cloud Computing (i.e. IaaS-only filter). In other words, this cut represents all of AWS’ portfolio and only Microsoft Azure so AWS overtakes Azure on the X-Axis (i.e. Market Share).
Now we’ve plotted some of the major SaaS vendors. And you can see ServiceNow and Salesforce are both large and have strong spending momentum. Workday somewhat less of a presence but solid Net Scores. SAP, despite some earnings challenges, actually is pretty impressive, right up there with Splunk and Tableau…Splunk has softened in recent surveys. And we’ve plotted NetSuite and Oracle Fusion, which are not looking too impressive compared to the momentum of the others.
AWS: Best to Stick to its Knitting
Back to the original question. We think for now anyway, AWS will position as the best, most friendly and highest quality cloud on which to run your SaaS. Workday runs on AWS and AWS is Salesforce’s preferred infrastructure platform. Infor’s SaaS also runs on AWS.
So our premise here is just like retail companies may not want to run on AWS, many SaaS companies that compete with Microsoft might think twice about running on Azure So AWS would be better off (for now) attracting SaaS players and sticking to infrastructure.
Snowflake is interesting. For context we’ve included them because their Net Score is off the charts and they’re an ISV running on the cloud. But they are different from the other SaaS players in that Snowflake is a database. Most of Snowflake’s business runs on AWS. AWS competes with Snowflake with RedShift but AWS has the best cloud and drives lots of business for Snowflake. And the reverse is true. It’s a mini version perhaps of Netflix and Amazon Prime Video.
So we think that AWS will continue to grow by attracting SaaS players as the preferred platform. And they’ll attract developers to try and disrupt SaaS players like ServiceNow, which runs on its own cloud. Years ago, when we first saw ServiceNow, we were impressed but we noted that by running its own cloud, at some point its infrastructure cost structure is going to be less competitive. ServiceNow has this multi-instance architecture which it can’t just port over to the cloud very easily. But it can charge a lot and it does.
At some point, some sharp developers we think are going to look at ServiceNow and other SaaS players and say “I can build this for less.” And they’ll attack the seat-based license models of the big SaaS players with a consumption pricing model that is more attractive and less expensive. Still, there are those who firmly believe that AWS will and must enter the SaaS space. And we talked last week about how beneficial Microsoft’s application business is for Azure. But we think not yet if ever. Give it some time – maybe four to five years before AWS may start to look at filling some spaces in SaaS.
Tech Rotation is Here to Stay
Ok so bottom line…it’s good to be in tech these days, it’s even better to be in cloud and it’s the best if you’re AWS and Microsoft…and we don’t see that changing for a while.
Remember these episodes are all available as podcasts – please subscribe. We publish weekly on Wikibon.com and Siliconangle so check that out and please do comment on the LinkedIn posts we publish. Don’t forget to check out ETR for all the survey action. Get in touch on twitter @dvellante or email david.vellante@siliconangle.com. And don’t forget, Breaking Analysis posts, videos and podcasts are all available at the top link on the Wikibon.com home page.
Thanks everyone, be well and we will see you next time.
Watch the full video analysis:
Photo credit: Igor Kovalchuk