We’ve often said that the next ten years in cloud computing won’t be like the last ten. Cloud has firmly planted its footprint on the other side of the chasm with the momentum of the entire multi-trillion dollar technology business behind it. Both sellers and buyers are leaning in by adopting cloud technologies and many are building their own value layers on top of cloud. In the coming years we expect innovation will continue to coalesce around the big 3 U.S. clouds, plus Alibaba in APAC, with the ecosystem building value on top of the hardware, software and tools provided by the hyperscalers. Importantly, we don’t see this as a race to the bottom. Rather our expectation is that the large public cloud players will continue to take cost out of their platforms through innovation, automation and integration. Other cloud providers and the ecosystem, including traditional IT buyers, will leverage hyperscale clouds and mine opportunities in their respective markets. This is not a zero sum game.
In this Breaking Analysis we’ll update you on our latest projections in the cloud market, share some new ETR survey data with some surprising nuggets; and drill into the important cloud database landscape.
What’s the Buzz in Cloud?
Let’s take a look at what people are talking about in cloud and some of the recent news.
Google Cloud
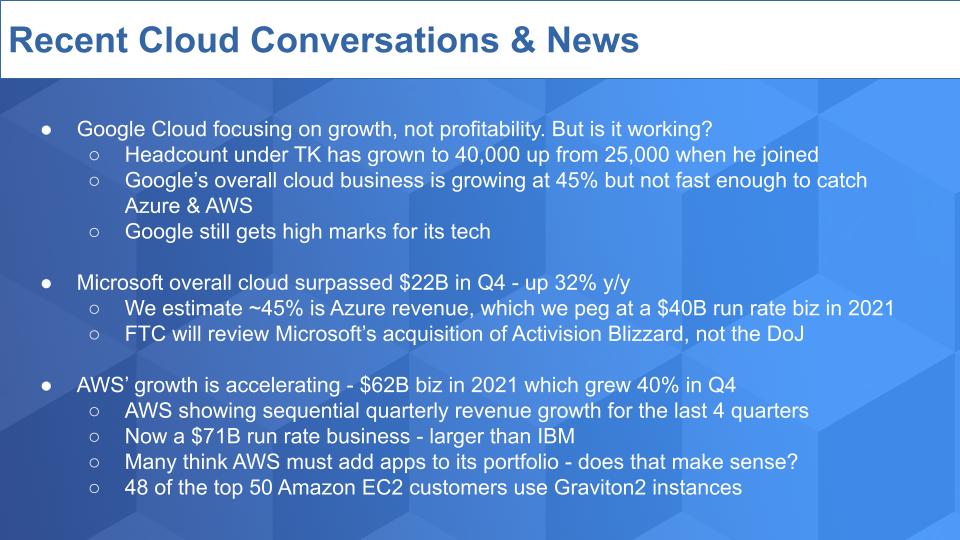
With the exception of Alibaba, all the large cloud players have reported earnings. Google continues to focus on growth at the expense of profitability. Alphabet reported that its cloud business, which includes applications like Google Workspace, grew 45% to $5.5B but it had an operating loss of $890M. Since Thomas Kurian joined Google to run cloud, Google has increased headcount in its cloud business from 25,000 to now 40,000 in an effort to catch up. But playing catch up is expensive.
To put this in perspective, AWS’ revenue in Q1 2018 was $5.4B, so almost exactly the same size as Google’s current total cloud business. And AWS was growing faster back then at 49%. Remember, Google includes in its cloud numbers a big chunk of high margin software. AWS had an operating profit of $1.4B that quarter; around 26% of its revenue. So it was a highly profitable business – about as profitable as Cisco’s overall business– which is a great business.
This is what happens when you’re #3 and didn’t get your head out of your ads fast enough.
Now in fairness, Google still gets high marks on the quality of its technology. According to Corey Quinn of the Duckbill Group, Amazon and Google Cloud are “neck and neck with regard to reliability,” with Microsoft’s Azure trailing because of significant disruptions in the past. These comments were made last week in a Bloomberg article despite some recent high profile outages on AWS. Not surprisingly a Microsoft spokesperson says that the company’s cloud offers “industry-leading reliability” and that it gives customers payment credits after some outages.
Microsoft Azure
Turning to Microsoft in cloud news. Microsoft’s overall cloud business surpassed $22B in the December quarter, up 32% year on year. Like Google, Microsoft includes application software and SaaS offerings in its cloud numbers and it gives nuggets of guidance on its Azure infrastructure-as-a-service business. We estimate that Azure comprises about 45% of Microsoft’s overall cloud business which we think hit a $40B run rate last quarter. Microsoft guided in its earnings call that recent declines in Azure growth rates will reverse in Q1 and show sequential growth.
Finally, it was announced that the FTC, not the DoJ, will review Microsoft’s $75B acquisition of Activision Blizzard. It appears FTC chair Lina Kahn wants to take this one on herself. She of course has been very outspoken about the power of big tech companies and in a recent CNBC interview suggested that the U.S. government’s actions were a meaningful contributor to curbing Microsoft’s power in the 1990’s. We found that a bit dubious. Just ask Netscape, Wordperfect, Novell, Lotus and SPC how effective the government was in curbing Microsoft’s power.
Generally, our belief is that the U.S. government has had a dismal record regulating big tech companies– most notably IBM and Microsoft. In our view, market forces, company hubris, complacency and self-inflicted wounds, not government intervention, were far more effective than the government at leveling the playing field. Now of course if companies are breaking the law they should be punished. But the U.S. government hasn’t been very productive in its actions and the unintended consequences of regulation could be detrimental to U.S. competitiveness in the race with China.
AWS
Lastly in the news, Amazon announced earnings on Thursday and the company’s value rose $191B the next day, a record increase in valuation for U.S. stocks. AWS grew revenue 40% year over year in the quarter. It closed the year at $62B and a $71B revenue run rate. AWS is now larger than IBM, which without Kyndryl is at a $67B run rate. IBM revenue was $107B in 2011.
There’s a conversation going on in the media and social that in order to continue this growth and compete with Microsoft, that AWS has to get into the SaaS business and offer applications. We don’t think that’s the right strategy for Amazon in the near future. Rather we see them enabling developers to compete and build out SaaS offerings.
Finally, Amazon disclosed that 48 of its top 50 customers are using Graviton2 instances. Why is this important? Because AWS is well ahead of the competition in custom silicon chips and is on a price performance curve that is far better than alternatives based on x86. This is one of the reasons why this business is not a race to the bottom. AWS’ moves in silicon are being followed by Google, Microsoft and Alibaba and this will continue to drive down their internal cost structures; and deliver price/performance equal to or better than historical Moore’s Law curves.
Big 4 Hyperscaler Revenue Surpasses $120B
Let’s take a look at how the year ended for the big 4 hyperscalers and look ahead to next year.
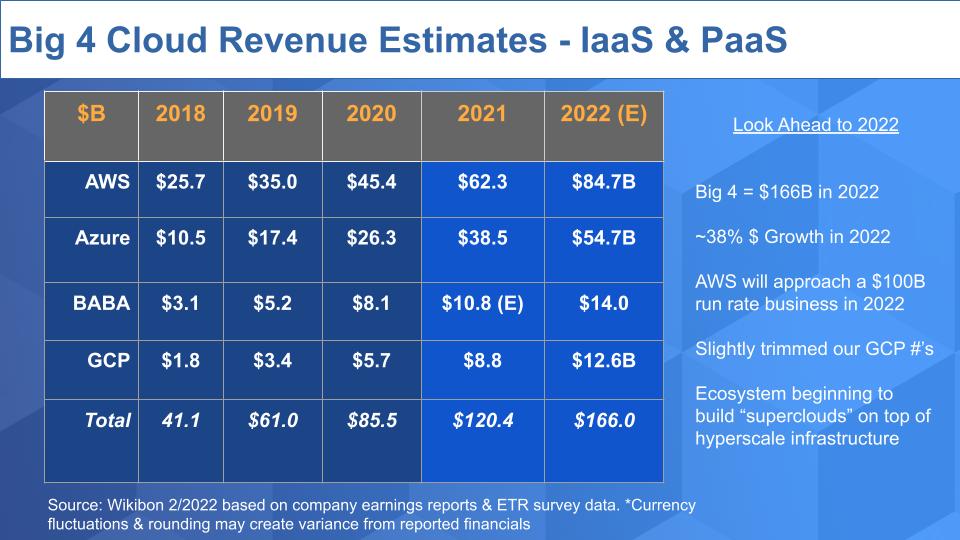
The table above shows revenue estimates for worldwide Iaas and PaaS generated by AWS, Microsoft, Alibaba and Google. Remember, Amazon and Alibaba share clean IaaS figures whereas Microsoft and Alphabet only give us nuggets that we have to interpret. We then correlate those tidbits with other data we gather. We’re one of the few outlets that actually attempts to make these apples-to-apples comparisons. Synergy Research is another firm that tracks this data and makes it public (no pay wall) but we can’t map to their numbers. Synergy’s GCP figures look high and Azure appears somewhat overestimated. And they include other sectors like hosted private cloud services but it’s another datapoint you can use.
Coming back to the table above. We’ve slightly adjusted our GCP figures downward based on comparing some of Alphabet’s statements in recent quarters and other survey data that caused us to be less sanguine. Only Alibaba has yet to announce earnings so we’ll stick to a 2021 market size of about $120B at a 41% growth rate relative to 2020. We expect that figure to increase by 38% to $166B in 2022.
These four companies have created an opportunity for the ecosystem to build what we’re calling superclouds on top of this infrastructure. We’re seeing it happen. It was increasingly obvious at AWS re:Invent and we feel it will pick up momentum in the coming months and years. More on that later.
AWS Gains Share in Q4 – Four Sequential Quarters of Accelerating Growth
The chart below shows a graphical view of the quarterly revenue shares for these four companies.
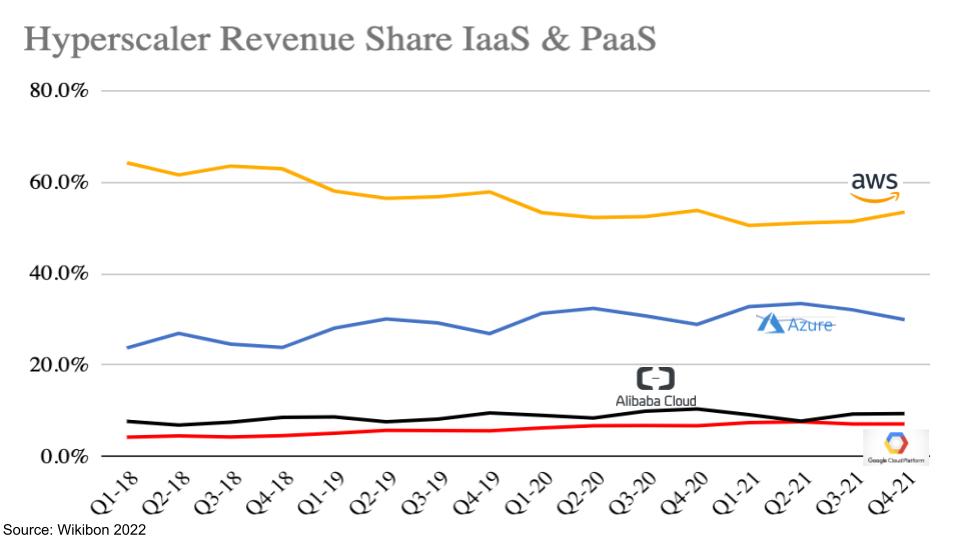
Notice that AWS has reversed its share erosion and is trending up slightly. AWS has accelerated its growth rate four quarters in a row now. It accounted for 52% of the big 4 hyperscale revenue last year and that figure was nearly 54% in the fourth quarter. Azure finished the year with 32% of hyperscale revenue in 2021, which dropped to 30% in Q4. And you can see GCP and Alibaba are neck and neck fighting for the bronze medal.
Notably, in our recent 2022 predictions post we said Google Cloud Platform would surpass Alibaba this year but given the recent trimming of our numbers, Google has some work to do for that prediction to come home.
Quarterly Cloud Growth Rates are Converging
To tie up the Wikibon market data, let’s look at quarterly growth rates in the chart below and you’ll see the compression trends.
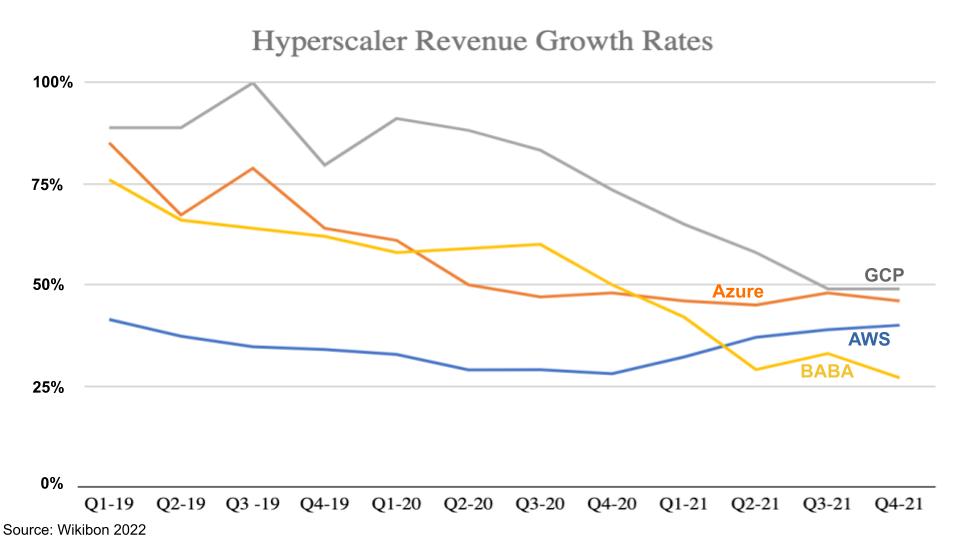
The data above tracks quarterly revenue growth rates back to Q1 2019 and you can see the steady downward trajectory and the reversal that AWS experienced in Q1 of last year. Now remember Microsoft guided for sequential growth in Azure so that orange line should trend back up. And given GCP’s much smaller and big go to market investments we’d like to see an acceleration there as well.
The performance of AWS is remarkable in that the company is able to accelerate growth at a $71B run rate business. Alibaba is a bit more opaque and is likely still reeling from the crackdown of the Chinese government big tech. We’re admittedly not as close to the China market but we’ll continue to watch from afar as that steep decline in growth rate is a concern.
Survey Data Shows Big Clouds Have Big Momentum
Oracle a Surprise Uptick in the Latest Survey Data
The chart below shows time series data on some of the select cloud platforms that are showing spending momentum in the ETR data set. ETR uses a metric called Net Score to measure that spending velocity of products and services. Net Score basically asks customers are you spending more, less or the same on a platform? And it subtracts the lesses from the mores and that yields a Net Score.
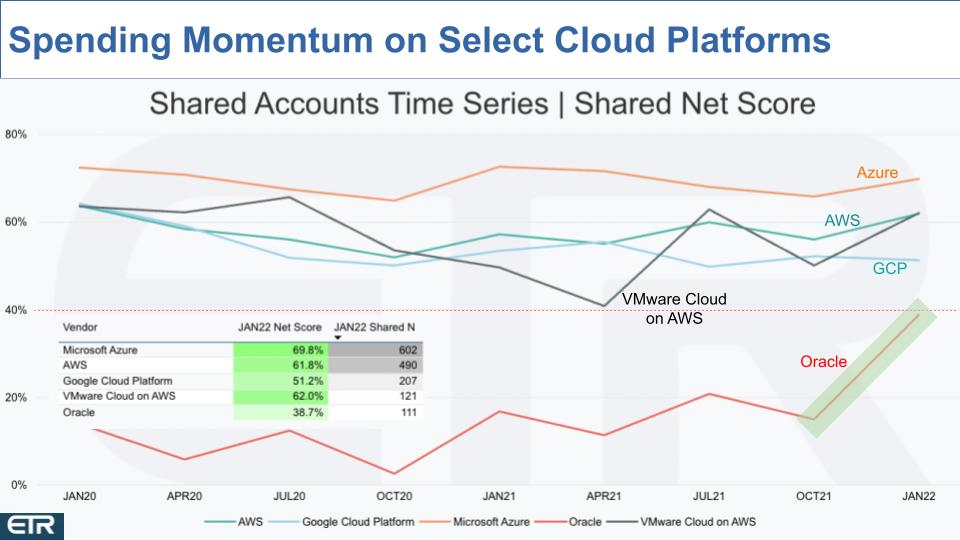
This chart shows Net Score for five cloud platforms going back to Jan 2020. Note the table that we’ve inserted. It shows Net Score and Shared N. The latter indicates the number of mentions in the data set and all the platforms we’ve listed here show a strong presence in the survey. The red dotted line at 40% indicates spending is at an elevated level.
You can see Azure, AWS and VMware Cloud on AWS, as well as GCP are all nicely elevated and bouncing off their October figures, indicating continued cloud momentum overall.
But the big surprise in these figures is the steady climb and the steep upward momentum from Oracle, which came in just under the 40% mark. Of course, one quarter is not necessarily a trend but going back to January 2020, the Oracle peaks keep getting higher and higher. So we definitely will keep watching this.
On-prem & Hybrids Show Respectable Momentum but Well Behind the Leaders
The chart below shows the same time series view for some of the other cloud platforms in the ETR survey.
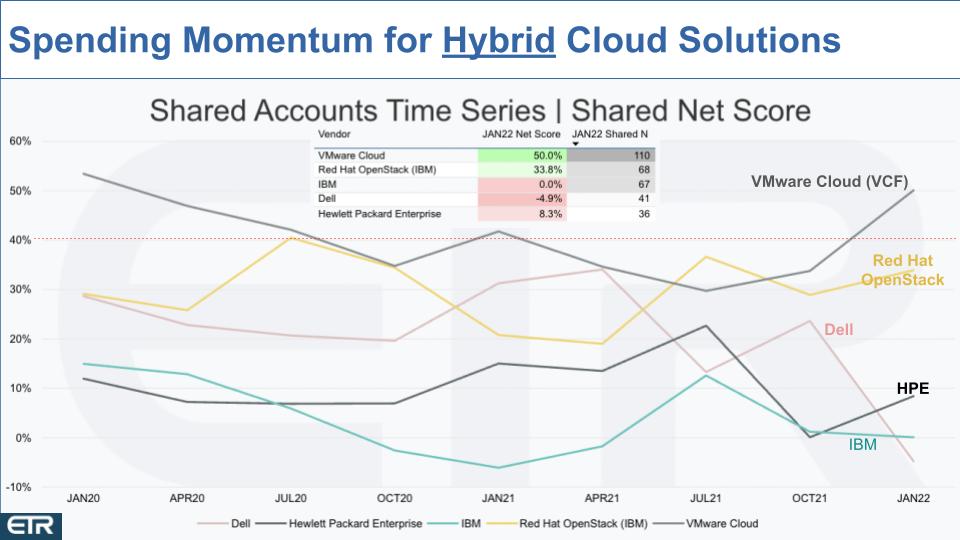
In the chart, we’ve now brought in some of the big hybrid players, notably VMware Cloud, which is VCF and other on-prem solutions. Red Hat OpenStack, which is still popular in telco’s who want to build their own cloud. We’re also starting to see HPE with GreenLake and Dell with Apex show up more. IBM, which years ago acquired SoftLayer, which was largely a bare metal hosting company, has leveraged that platform to cobble together its own public cloud. Having largely missed the cloud wave, IBM is now racing after hybrid cloud using Red Hat OpenShift as the linchpin to its strategy.
What this data tells us is first of all, these platforms don’t have the same presence in the data set as do the previous players. VMware is the one possible exception with a Shared N of 110. Other than VMware, these players don’t have the spending velocity shown in the previous chart and most are below the red line.
HPE and Dell are interesting. They’re transitioning early private cloud businesses to GreenLake and Apex respectively. And finally, after years of staring at their respective navels in cloud and milking legacy on-prem models, they’re building out cloud-like infrastructure, services and pricing models for their customers. They’re leaning into the cloud and marketing it in a more sensible and attractive fashion. As such, we expect these figures to bounce around for those two as they transition installed bases and finally settle into a groove swing. We’ll continue watch that closely as well.
Over to IBM. The company is in the process of a major do-over. Arvind Krishna inherited three generations of leadership with a professional services mindset. In the post Gerstner era, both Sam Palmisano and Ginni Rometty held on far too long to IBM’s service heritage and protected the past from the future. Missing the cloud opportunity and forcing the acquisition of Red Hat to position the company for the hybrid cloud wars. Rometty tried to shrink to grow but never got there. Krishna is moving faster to rip off the band-aid and, with the Kyndryl spin, is promising mid single digit revenue growth which would be a welcome change. IBM has a lot of work to do and we would expect its Net Score figures as well to bounce around as customers transition to the future.
Plotting the Cloud Platforms Shows the Impressive Position of AWS & Azure
Let’s take a look at all these players in a different context.
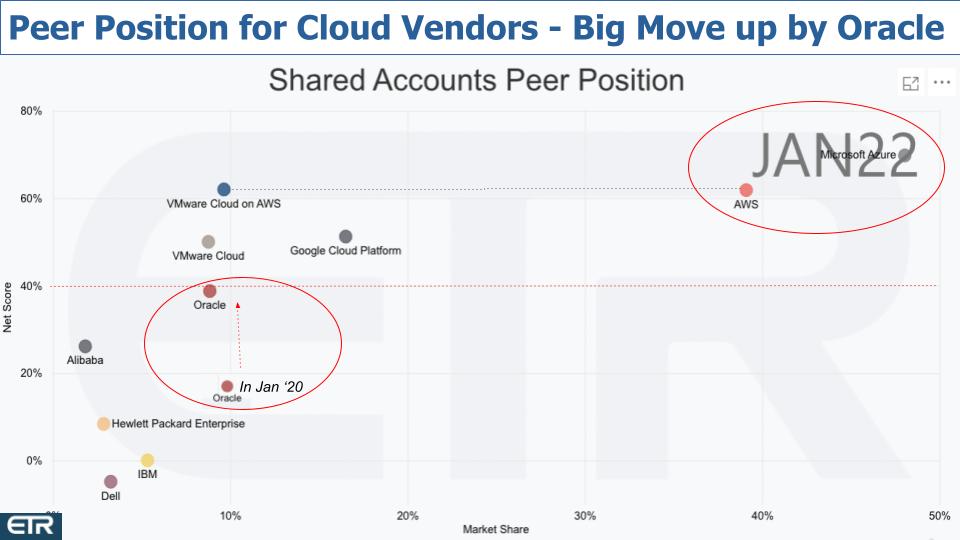
The chart above plots all the clouds we just mentioned but in a two dimensional view. The vertical axis is Net Score or spending velocity and the horizontal axis is Market Share or pervasiveness in the data set. There are a few key callouts we’d like to make here.
- The data confirms what we’ve said for a while, AWS and Microsoft stand alone with a huge presence, many tens of billions in revenue – yet they are both well above the 40% line and noticeably ahead of GCP on both dimensions.
- VMware, while much smaller, is showing legitimate momentum, which correlates to its public statements.
- Alibaba doesn’t really have a big sample in the survey and you can see HPE, Dell and IBM have some work to do but are starting to show a bigger presence in the survey. But the spending momentum is still not there when compared to the leaders.
- Oracle is the big surprise. Look where Oracle was in the January survey and how they’ve shot up recently.
We’ll see if this holds but let’s posit some possibilities as to why.
Oracle is the King of Mission Critical Applications
If you haven’t seen the video below on Twitter, you have to check it out. It’s hilarious. And it’s worth reading the comments.

We won’t run the video here but the link on the pictures will take you there. Here’s the short version. Some really creative person overlaid a database migration narrative on top of this one tooth guy who speaks in Spanish gibberish. But the setup is he’s a PM at a bank and AWS came in and said “we can move all your apps to the cloud in 12 months.” And the guy says “but wait we’re running mission critical apps on Exadata” and AWS says “there’s nothing special about Exadata.” And the guy starts howling and laughing and talking about the 23 year old senior engineer wearing expensive sneakers and what a nightmare they encountered migrating their environment.
To anyone who has ever gone through a major migration of mission critical systems this will hit home. It’s funny/not funny. The point is it’s really painful to move off of Oracle. And Oracle, for all its haters and all its faults, is really the best environment for mission critical systems. Customers know it.
What’s happening is Oracle is building the best cloud for Oracle database and mission critical applications. It has a lot of really profitable customers running on-prem that the company is migrating to Oracle Cloud Infrastructure (OCI). And because you can get the same integrated Exadata hardware and software to run your database in the Oracle cloud, Oracle has an advantage over its competitors. Not only is Oracle investing to optimize its cloud infrastructure for mission critical applications, it’s making it more cost effective by penalizing customers that run Oracle elsewhere. You see, Oracle jacks up the license fees for running its software on other clouds, allowing it to claim Oracle is cheaper (this is all negotiable by the way).
It might be funny to write a narrative around those Oracle tactics with the mono-toothed guy chattering away.
Analysts Highly Rate Oracle’s Cloud Database
Oracle’s differentiated position helps explain why, for example, the Gartner Magic Quadrant for cloud databases and other analysis has Oracle so well-positioned.
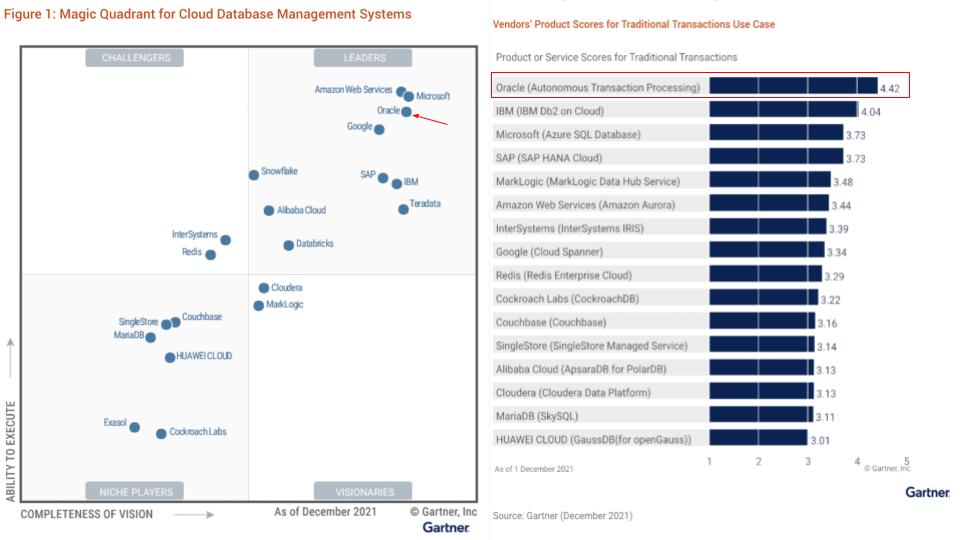
See for yourself in the above graphics. Oracle’s position on the quadrant is right there with AWS and Microsoft; and ahead of Google. On the right hand side is Gartner’s critical capabilities ratings for DBMS in operational use cases. Oracle leads in virtually all the categories Gartner tracked. The graph above shows traditional transactions but Gartner has Oracle ahead of all vendors in stream processing, operational intelligence and real-time augmented transactions.
Now Gartner are like old mainframers – and we say that lovingly – so maybe they’re a bit biased and might be missing some of the emerging opportunities that, for example, Snowflake is pioneering. But it’s hard to deny that Oracle, for its business, is making the right moves in cloud by optimizing for the red stack. There’s little question of that in our view and when it comes to mission critical, we think Gartner’s analysis is correct.
There’s More to the Story Beyond Oracle’s Narrow Sweet Spot
There’s a really exciting landscape emerging in cloud data. Snowflake calls it the data cloud, Zhamak Dehghani calls it data mesh, others call it data fabric, Databricks calls it data lakehouse…so does Oracle. The terminology will evolve.
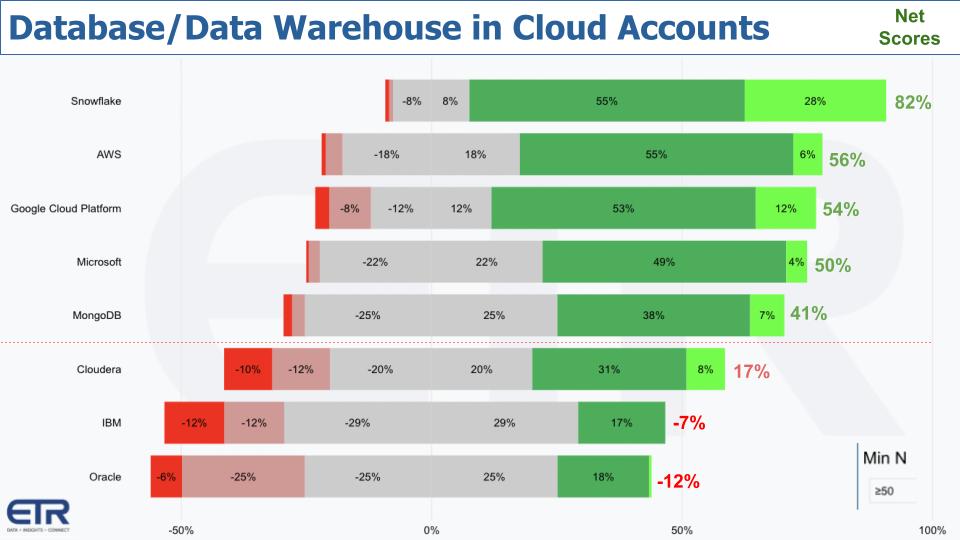
Most of the action is happening in the cloud quite frankly. The chart above shows a select group of database and data warehouse companies filtered within AWS, Azure and GCP accounts. To make the cut, the vendor had to have a minimum of fifty mentions in the survey. Unfortunately Databricks didn’t make it – just not enough presence in the data quite yet. Just to give you a sense. Snowflake is represented in this cut with 131 accounts. AWS 240, Google,108, Microsoft 407 (wow), MongoDB 117, Cloudera 52 IBM 92 and Oracle 208.
These are shared accounts filtered by customers running AWS, Azure or GCP.
The chart shows Net Score. The lime green is new additions of the platform. Forest green is spending more (6%+). The gray is flat spending (+/- 5%). The pink is spending less (-6% or worse). The bright red is defection– i.e. retiring the platform. Once again, subtract red from green and you get Net Score.
You can see that Snowflake, as we reported last week, is tops in the data set with a Net Score in the 80’s and virtually no red. And even single digit flat spend. AWS, Google and Microsoft all are prominent in the data set as are Mongo and Snowflake and they’re all elevated over the 40% mark.
Cloudera – what can we say? Once a high flier just not in the news anymore with anything compelling other than they took the company private last year. So maybe they can re-emerge at some point with a stronger story – we hope so. Because as you can see above they actually have some new additions and spending momentum in the green. Unfortunately, just a lot of customers holding steady and a bit too much red. But they’re in positive territory.
Unlike IBM and Oracle. And this is the flip side of the coin.
IBM is knee deep…really chest deep, in the middle of a major transformation. We’ve said before, Arvind Krishna’s strategy and vision is at least achievable. Prune the portfolio – i.e. spin out Kyndryl and sell Watson Health. Hold serve with the mainframe and deal with the cycles. Shift the mix to software and use Red Hat to win the day in hybrid. Red Hat is working for IBM– growing well into the double digits.
Unfortunately it’s not showing up in the chart above with little database momentum in AWS, Azure and GCP accounts. Zero new adds, not enough acceleration in spending…a big gray middle and nearly a quarter of the base in the red. IBM’s data and AI business only grew 3% this past quarter. And the word database wasn’t mentioned once on its earnings call. This has to be a concern as you see how important database is to AWS, Microsoft, Google and how it’s propelled the momentum of companies like Snowflake, MongoDB, Cockroach, Redis, Couchbase and MariaDB.
The Mixed Picture in the Oracle Data
Which brings us to Oracle with a Net Score of -12. So how do you square the momentum in Oracle cloud spending and the strong ratings in database from Gartner with the picture above? Good question.
To this we would say the following. First, look at the profile above. People aren’t adding Oracle new. A large portion of the base, 25%, is reducing spend by 6% or worse. And there’s a decent percentage of the base migrating off of Oracle (6%). With a big fat middle that’s flat. And this accounts for the poor Net Score overall.
What ETR doesn’t track, however, is how much is being spent. Rather it’s an account-based model. And Oracle is heavily weighted toward big spenders running mission critical applications and databases. Oracle’s non-GAAP operating margins are comparable to IBM’s gross margins on a percentage basis. So a very profitable company with a big license and maintenance installed base. Oracle has focused its R&D investments into cloud, ERP, database, automation, vertical SaaS and integrated hardware and software and this drives differentiation for the company.
But as you can see in the ETR data, it has a legacy installed base that is constantly trying to minimize its license costs.
Newer Database Players Fare Well in AWS, Azure & GCP Accounts
Below is a more comprehensive view of the same companies. We expand the picture with the two dimensions of Net Score on the Y axis and Market Share or pervasiveness on the horizontal axis.
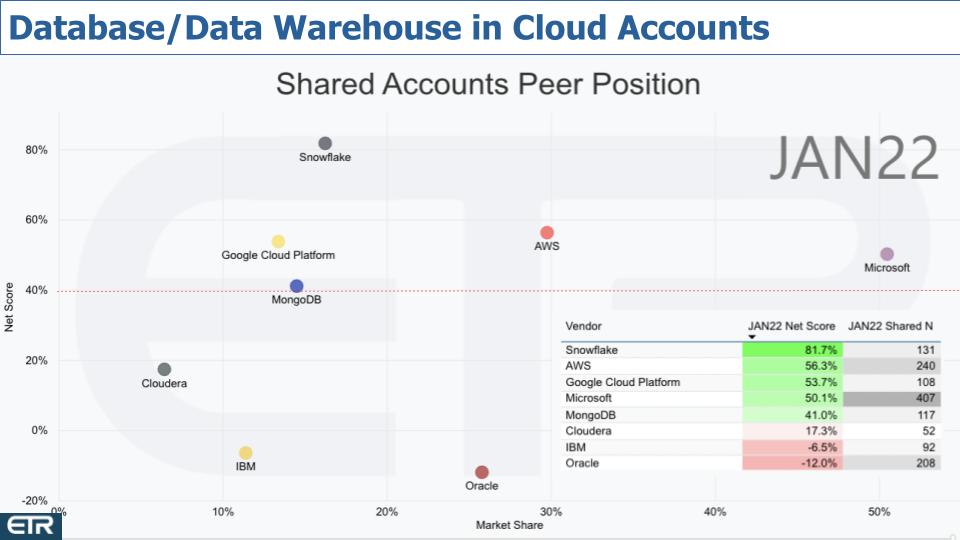
The table insert informs the position of the dots – Net Score on the Yand Shared N driving the X axis.
There’s not much to add here other than to say the picture continues to look strong for those companies above the 40% line that are focused, relatively new and have figured out a clear cloud strategy. The ones below the line definitely have parts of their portfolio which show solid momentum but they’re fighting the inertia of a large installed base that moves slowly.
Looking Ahead in Cloud
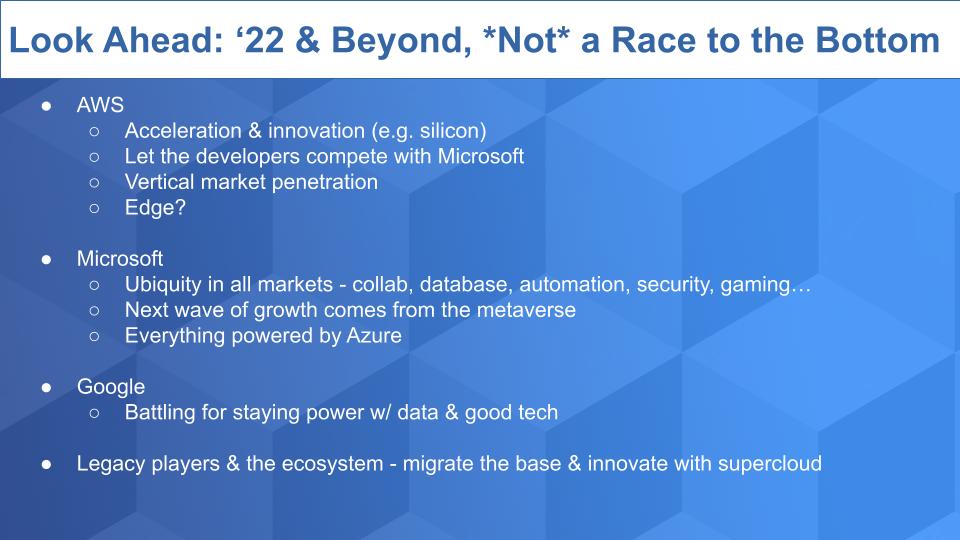
Starting with the big 3 cloud players. AWS is accelerating and innovating – great example is custom silicon with Nitro, Graviton and other chips that will help the company address concerns related to the race to zero – it’s not.
AWS we believe will let its developers go after the SaaS business and for the most part, AWS will offer solutions that address large vertical markets – like call centers.
The edge remains a wildcard for AWS and all the cloud players. AWS believes that in the fullness of time, all workloads will run in the public cloud. It’s hard to imagine Tesla autonomous vehicles running in the public cloud but maybe AWS will redefine what it means by cloud.
Microsoft. Well they’re everywhere and now they’re expanding further into gaming and the metaverse. When he became CEO in 2014, many people said Satya should ditch Xbox. The joke among many Oracle employees back then was that Safra Catz would buy her kids and nieces and nephews and kids’ friends Xbox game consoles for the holidays because Microsoft lost money for every one it shipped.
Well Nadella has stuck with it and sees an opportunity to expand through online gaming communities. One of his first deals as CEO was Minecraft. Now the acquisition of Activision will make Microsoft the world’s #3 gaming company by revenue, behind only Tencent and Sony. All this will be powered by Azure and drive more compute, storage, AI and tools.
Google for its part is battling to stay relevant in the conversation and keep up. Luckily it can afford the massive losses it endures in cloud because the company’s advertising business is so profitable. Don’t expect, as many have speculated, that Google will bail on cloud. That would be a huge mistake as the market is more than large enough for three players.
Which brings us to the rest of the pack. Cloud ecosystems generally and AWS’ specifically are exploding. This idea of supercloud – that is a layer of value that spans multiple clouds and hides the underlying complexity, is starting to bubble to the top. Legacy players are staying close to their customers and fighting to keep them spending – and it’s working. Dell, HPE, Cisco and smaller predominantly on-prem players like Pure Storage continue to do relatively well. They’re just not as sexy as the big cloud players.
The real interesting activity is happening in the ecosystem of firms within industries that are transforming to create their own digital businesses. Virtually all of them are running a portion of their offerings in the public cloud – but often connecting to on-premises workloads and data. Making that work and creating a great experience across all environments is a large opportunity and we’re seeing it form right before our eyes.
Don’t miss it!
Keep in Touch
Thanks to Stephanie Chan who researched several topics for this episode. Remember we publish each week on Wikibon and SiliconANGLE. These episodes are all available as podcasts wherever you listen.
Email david.vellante@siliconangle.com | DM @dvellante on Twitter | Comment on our LinkedIn posts.
Also, check out this ETR Tutorial we created, which explains the spending methodology in more detail.
Watch the full video analysis:
Note: ETR is a separate company from Wikibon and SiliconANGLE. If you would like to cite or republish any of the company’s data, or inquire about its services, please contact ETR at legal@etr.ai.
All statements made regarding companies or securities are strictly beliefs, points of view and opinions held by SiliconANGLE media, Enterprise Technology Research, other guests on theCUBE and guest writers. Such statements are not recommendations by these individuals to buy, sell or hold any security. The content presented does not constitute investment advice and should not be used as the basis for any investment decision. You and only you are responsible for your investment decisions.