The rapid awareness and adoption of AI has increased concerns around security, governance, compliance and business risk. The digital business imperative to improve customer experience combined with a vastly more complex technology environment, comprising multiple clouds, IoT, containers, app integration and the popularity of open source, are driving need for better observability across technology stacks. But fragmented IT environments, lack of talent and a spate of existing installed monitoring tools are preventing organizations from achieving their full stack observability aspirations.
In this Breaking Analysis we dig deeper into the trends in observability based on a recent custom study from our partners at Enterprise Technology Research. As always we’ll provide our perspective on the market and players with a view toward trends to watch in 2024.
What is Full Stack Observability (FSO) & O11Y?
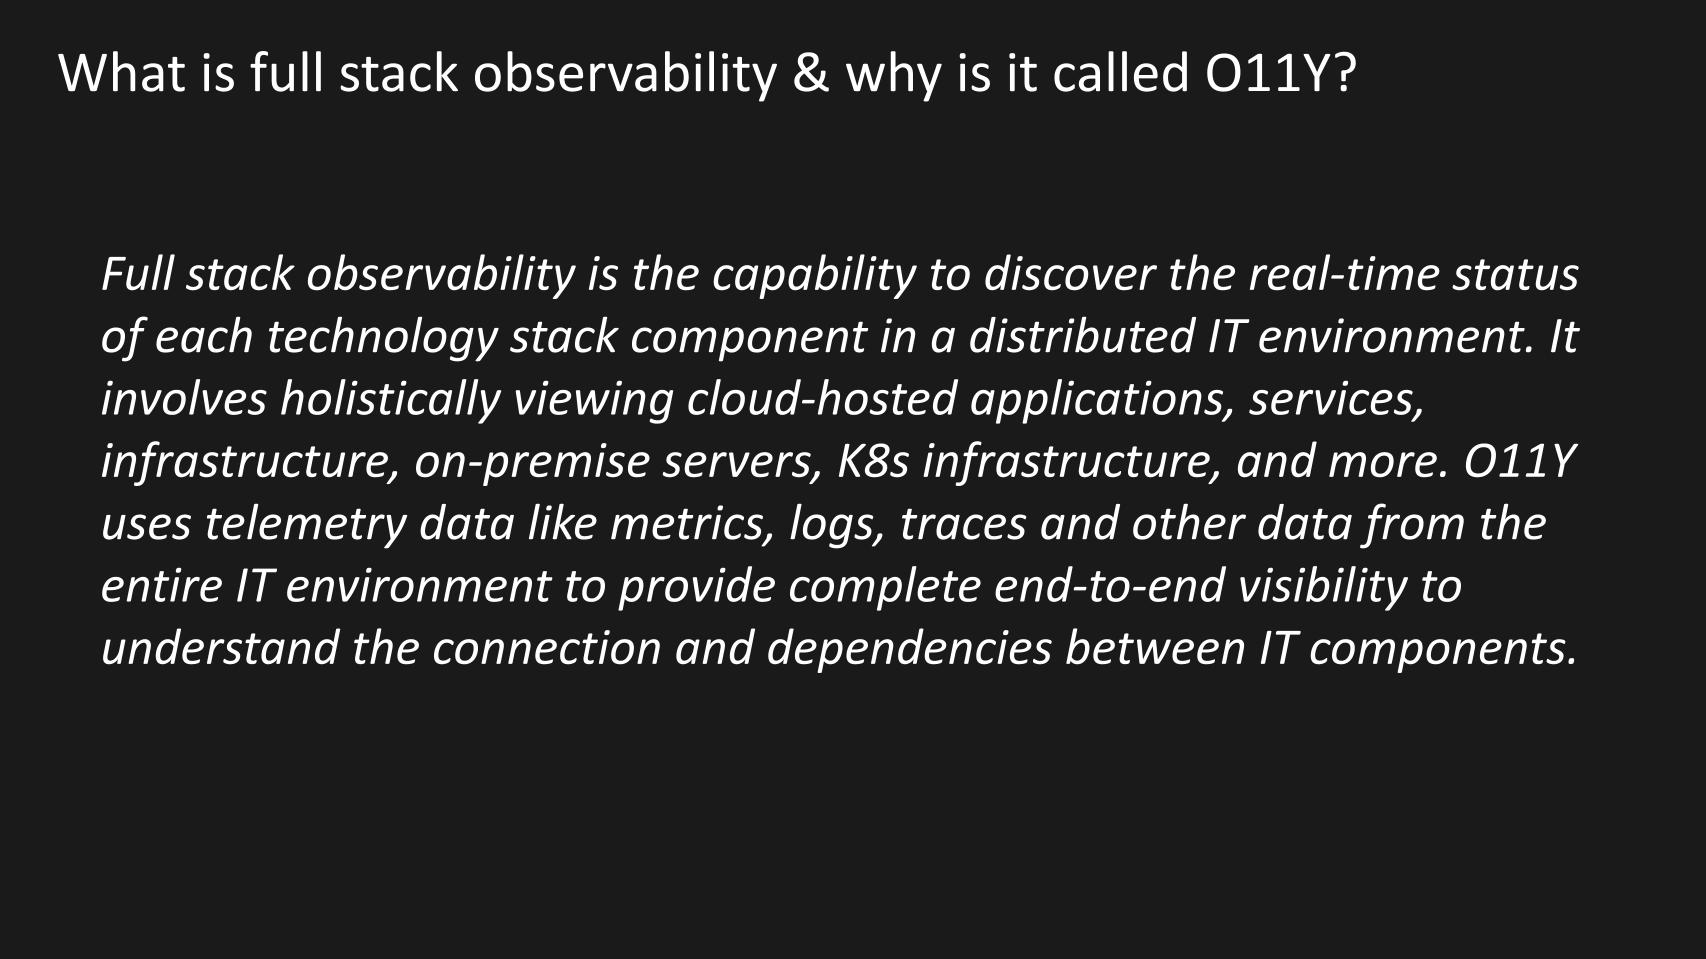
Full stack observability is the capability to discover the real-time status of each technology stack component in a distributed IT environment. It involves holistically viewing cloud-hosted applications, services, infrastructure, on-premises IT, K8s (there’s your O11Y hint) infrastructure, and more. O11Y uses telemetry data like metrics, logs, traces and other information from the entire IT environment to provide complete end-to-end visibility to understand the connection and dependencies between IT components.
FSO is more than just monitoring and reporting. It uses reasoning and often machine intelligence to draw conclusions about an environment to recommend change or even take action on behalf of humans.
New Survey Captures the Customer Mindset of FSO
FSO or O11Y has been a hot topic in the press and analyst community. That’s why we’re so excited to share the results of a recent study from ETR.
ETR has an amazing custom research capability that we’re privileged to share with you. This particular study was done in partnership with New Relic who we promise has zero influence on the commentary and conclusions of this Breaking Analysis or the ETR analysis.
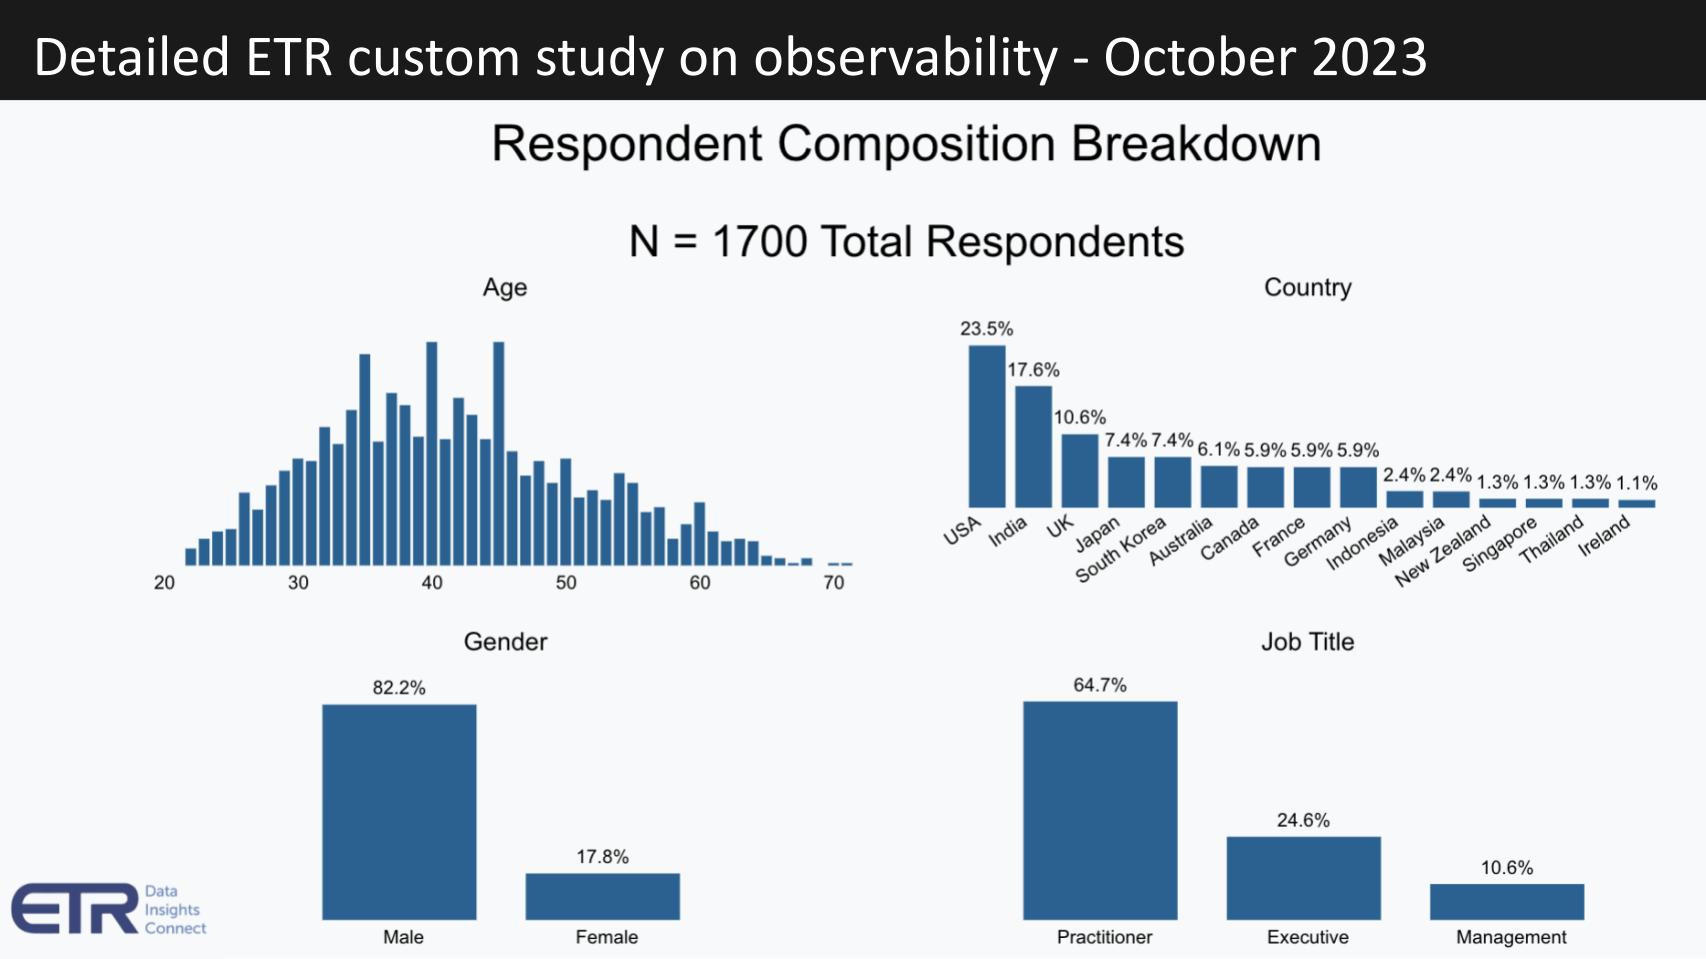
This particular study had 1,700 respondents and unlike most of the work we share had a global respondent base with US customers only accounting for about a quarter of the survey. The companies spanned multiple industries, all organization sizes (80% more than 5,000 employees) and mostly technology practitioners.
Like Security, Observability is a Crowded Market.
It has grown out of the world of application performance monitoring (APM), network monitoring, log analytics, AIOps, database performance management, dashboarding, error tracking and literally dozens of legacy and fragmented market segments. There are literally dozens and dozens of vendors in this space.
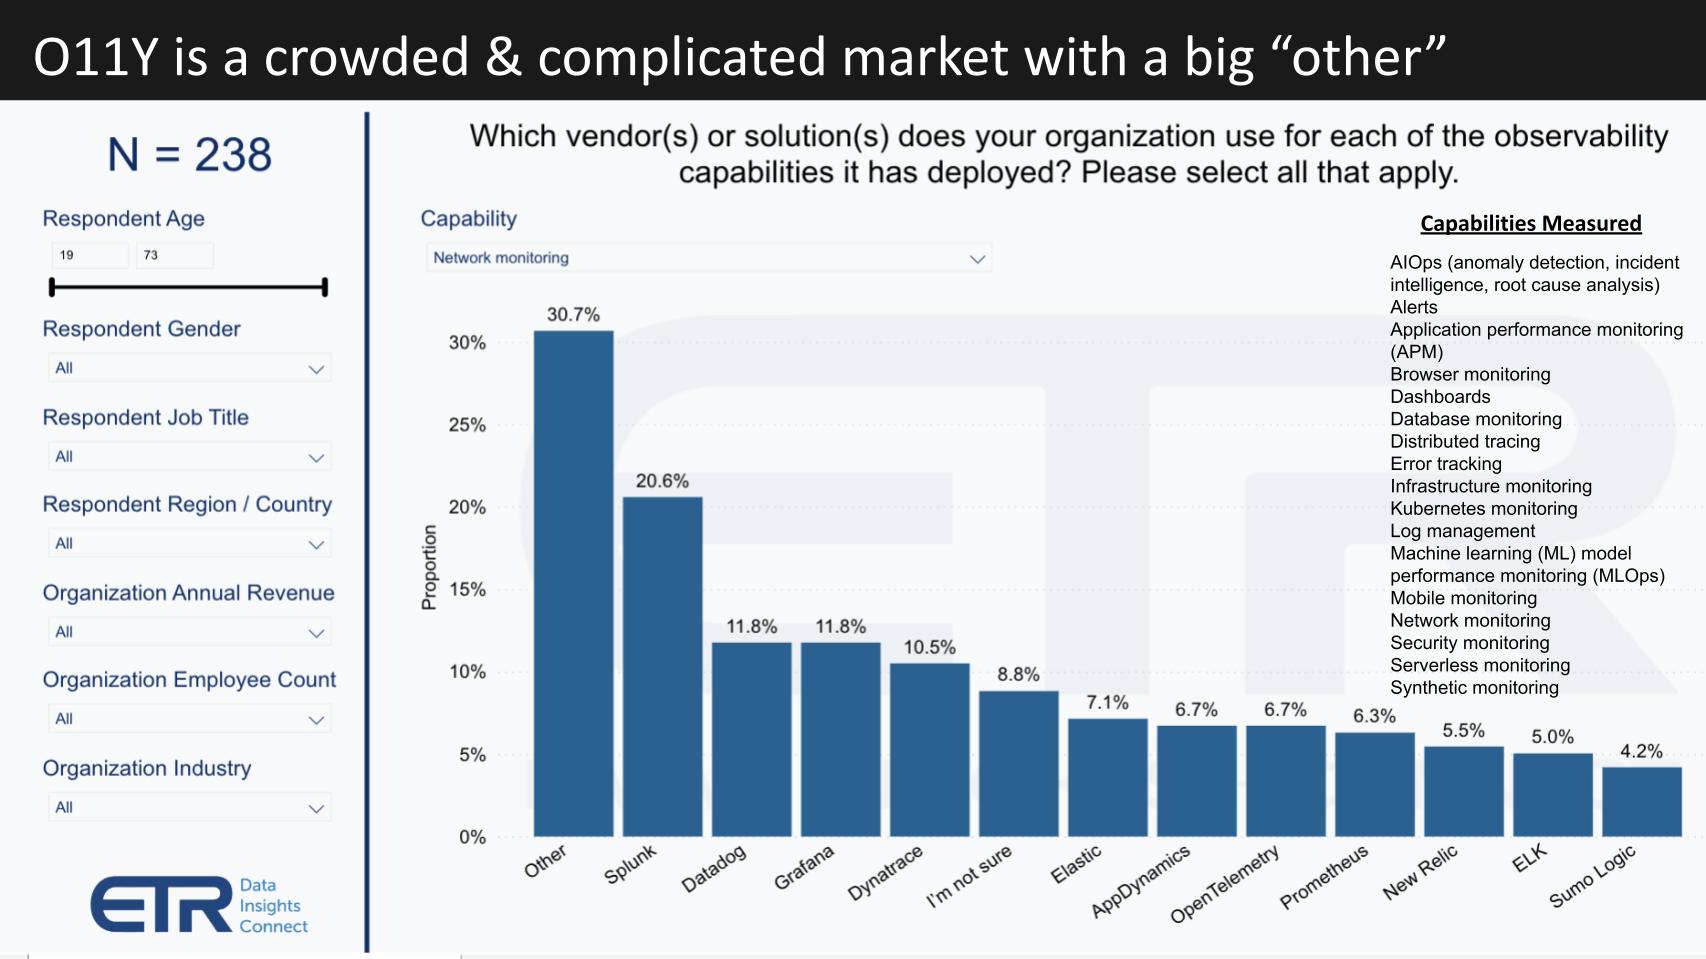
Here’s a sample using network monitoring as the sector of choice. In this space “other” is the leading vendor which underscores how crowded the market is. But the likes of Splunk, Grafana, Dynatrace, Elastic, AppDynamics – open source tools like OpenTelemetry, Prometheus and the ELK stack – New Relic, Sumo Logic and more play in this specific market.
On the right hand side of this chart you can see the sectors ETR tracked in this study – around eighteen including distributed tracing, serverless monitoring, mobile monitoring, MLOps and so forth. Selecting each one in the pulldown will shuffle the deck of players.
Splunk leads in most but as the leader everyone wants to attack them and get a piece of their market. It’s why Cisco paid $28B for Splunk because it has the largest footprint. But there are many others. For example in application performance monitoring, Datadog, Dynatrace, AppD (Cisco) and New Relic join Splunk at the top of the list. In synthetic monitoring, Dynatrace and Datadog pop up as most popular along with Splunk. In distributed tracing, Grafana, Dynatrace, Prometheus and OpenTelemetry are cited more often than Splunk. And other is always prominent.
You get the point. FSO involves a lot of different capabilities and there are many vendors playing in the market. For example – here are some names in the other category you may or may not know: Lucidworks, Exabeam, Sentry, Moogsoft, Honeycomb, Chaossearch, Graylog, ScienceLogic, Cribl, MonteCarlo, Observe, InfluxData and dozens more I could name. It’s crowded.
Consolidation Continues to be a Theme, but it’s not Easy
Because the market is so fragmented and the budget pressures of 2022 and 2023 have caused a consolidation of tools.
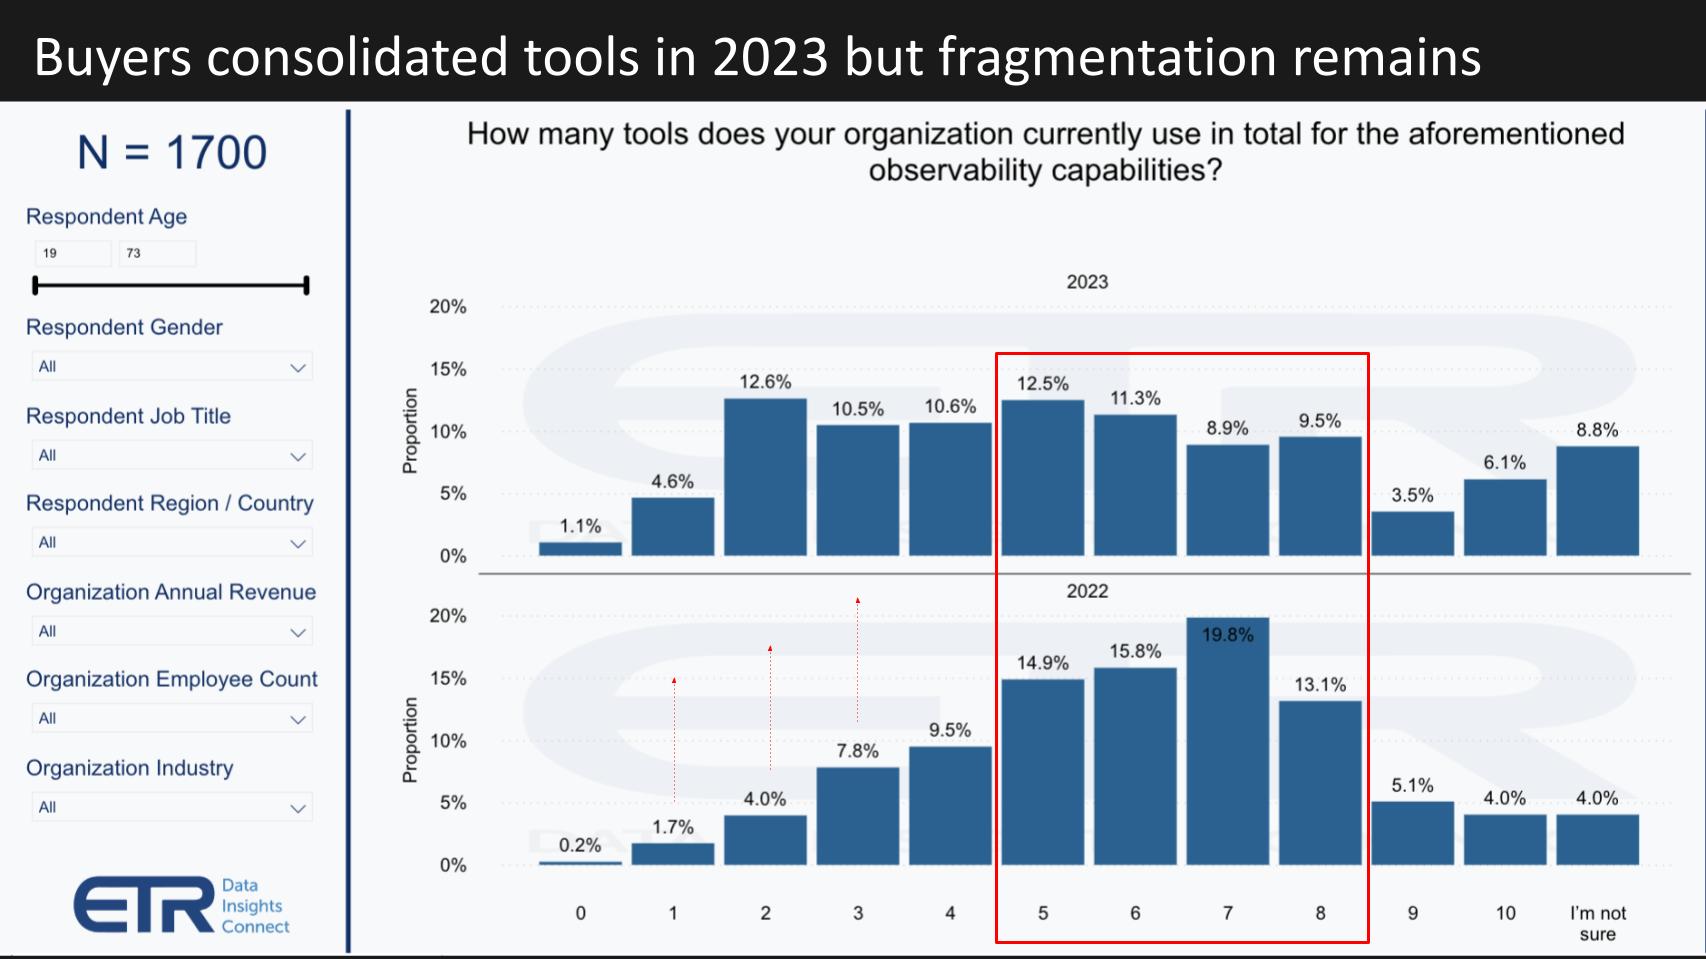
This chart shows the number of observability tools installed in 2023 (top) as compared to 2022 (bottom). And you can see the reduction in the percent of customers with 5, 6, 7 and 8 tools – highlighted in red. And the shift to 1, 2 and 3 tools installed shown by the red arrows. But its clear that the movement in the past year is just scratching the surface as around 60% of customers cite that they have four or more tools. So more work must be done to accommodate greater consolidation. Having said that, around 30% of customers in the survey lean toward having multiple tools as a means of tapping best of breed capabilities.
Like security, the quest for excellence often results in fragmentation.
Which Vendors Benefit Most from Consolidation?
When asked which vendor platforms customers prefer to consolidate on…around 13% say they don’t want to consolidate. But Splunk, Dynatrace and Datadog are most commonly cited.
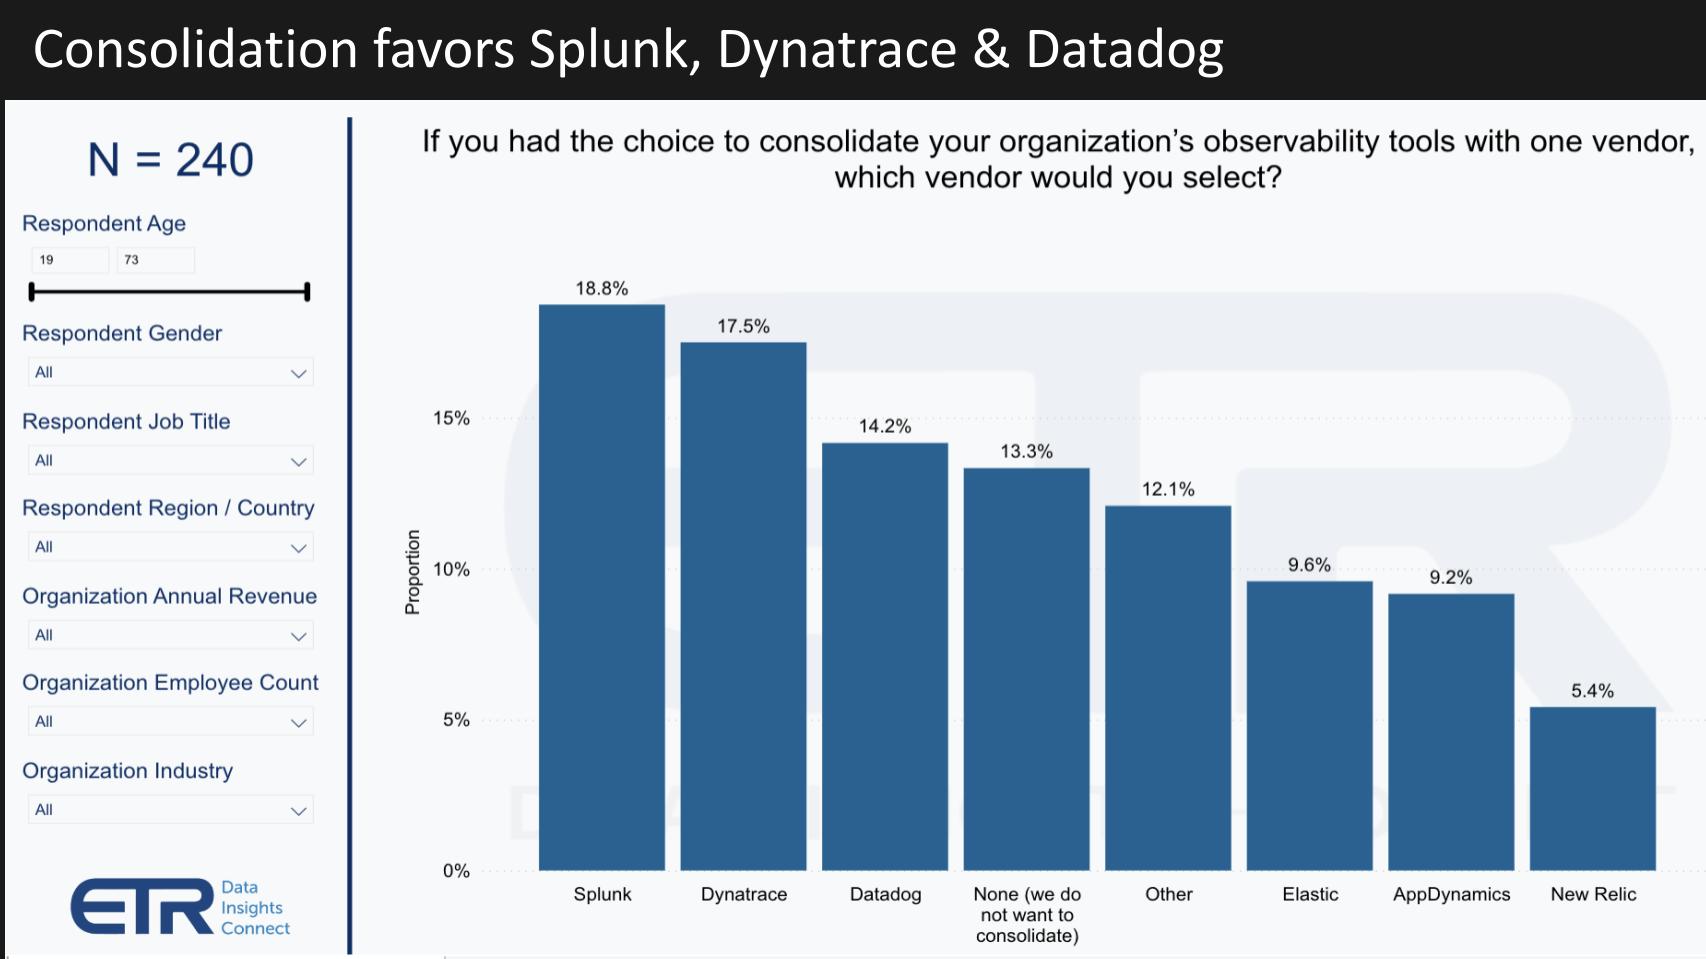
Once again, other is in the mix pretty prominently with Elastic, AppD and New Relic also showing.
Now some interesting things change when you filter the data. For example, executive management prefers to consolidate on Dynatrace and surprisingly a somewhat higher percentage, 16% say they don’t want to consolidate.
For what it’s worth, the small percentage of females in the survey want to consolidate on AppDynamics, a company Cisco acquired in 2017. Services and consultancies prefer to consolidate on Datadog.
So again this just underscores the complexity and varied preferences of the market.
Humans are Still in the Loop
Another notable finding in the survey is the degree to which manual labor is still a dominant force.
Despite the AI hype, a less than 10% of customers say their incident detection and remediation workflows in the future will be mostly AI-led. But a huge percentage – around 75% as shown on this chart – expect to have some type of AI-led automation in their identification and remediation workflows.
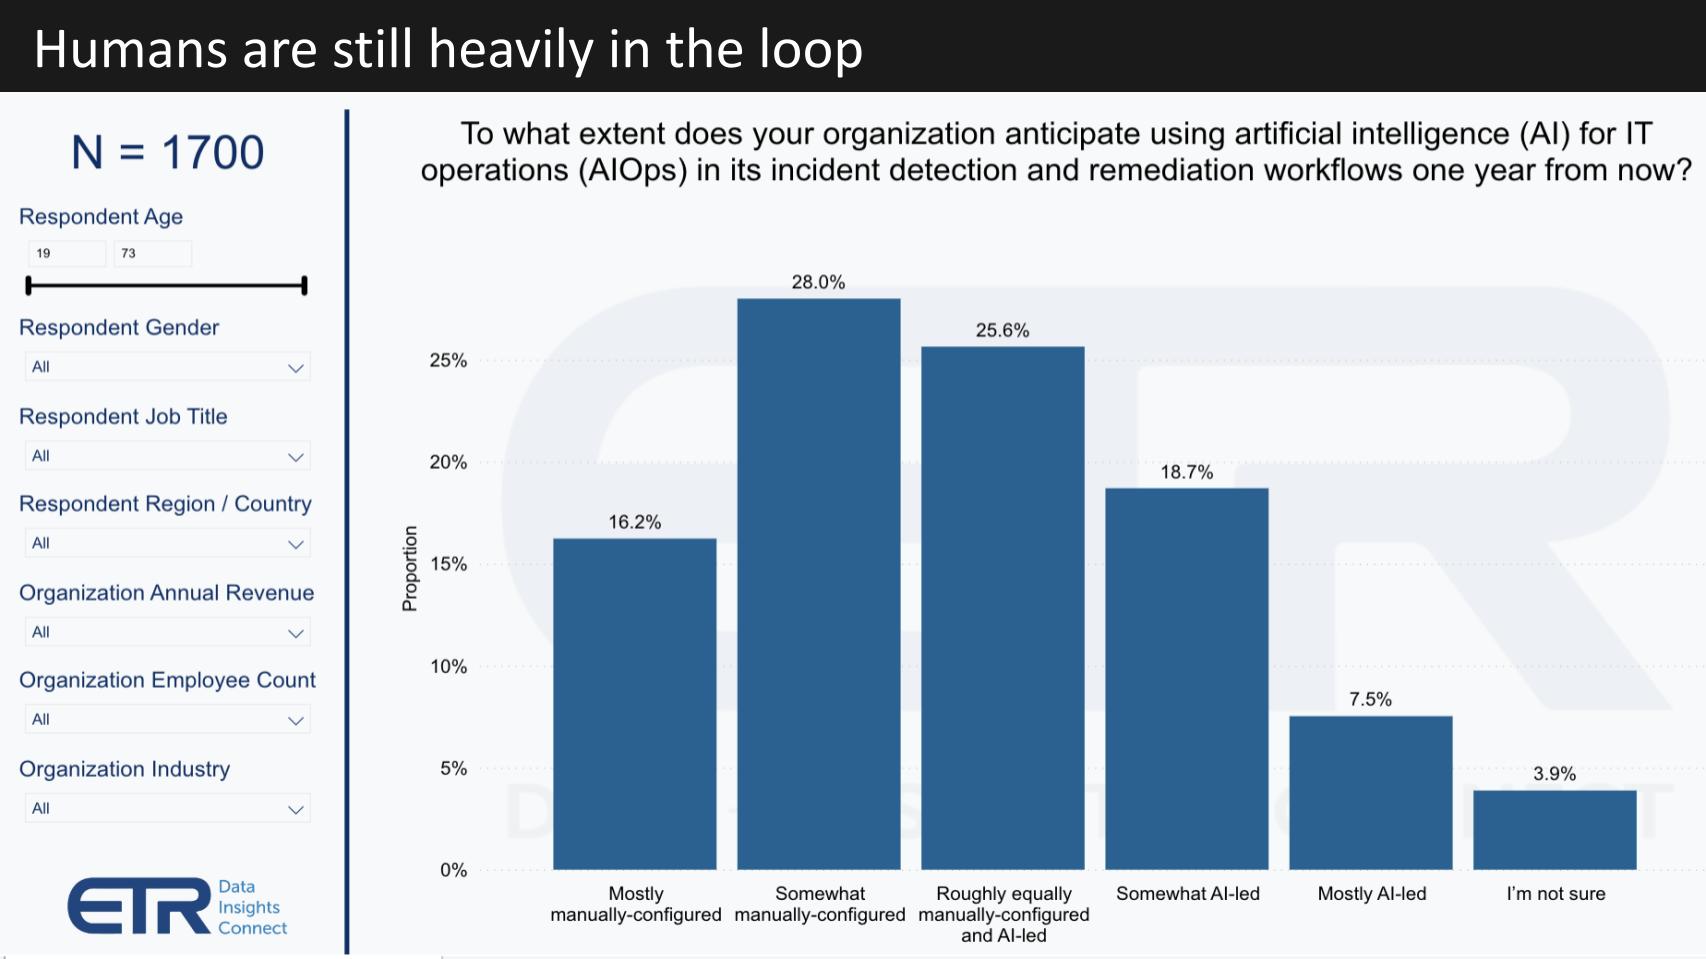
Automation is a two-edged sword. It’s one of those alluring concepts but there’s real caution around trusting machines to judge what actions should and shouldn’t be taken and when. So given the sensitive nature of change management, we would expect this trend to continue to lean toward AI-led automation but it will take some time before humans are mostly out of the loop. Moreover, while many vendors claim to have AI, there’s a wide spectrum of capabilities and customers should be very cautious about vendor claims in this regard.
Now not surprisingly, the regulated industries of financial services, healthcare and government see a much lower tendency to be mostly-AI led in this context over the next year (well under 5% say mostly AI-led in this chart)…whereas industries like energy and high tech are much more likely to aggressively adopt AI in this space.
Interestingly, the data show that senior managements are more likely to push for AI adoption whereas the practitioners, who literally have their jobs on the line – i.e. machines replacing humans or getting fired for implementing rogue automation – are much less optimistic.
What Does O11Y do for Your Business?
According to more than 1,500 practitioners in this survey, there are many benefits.
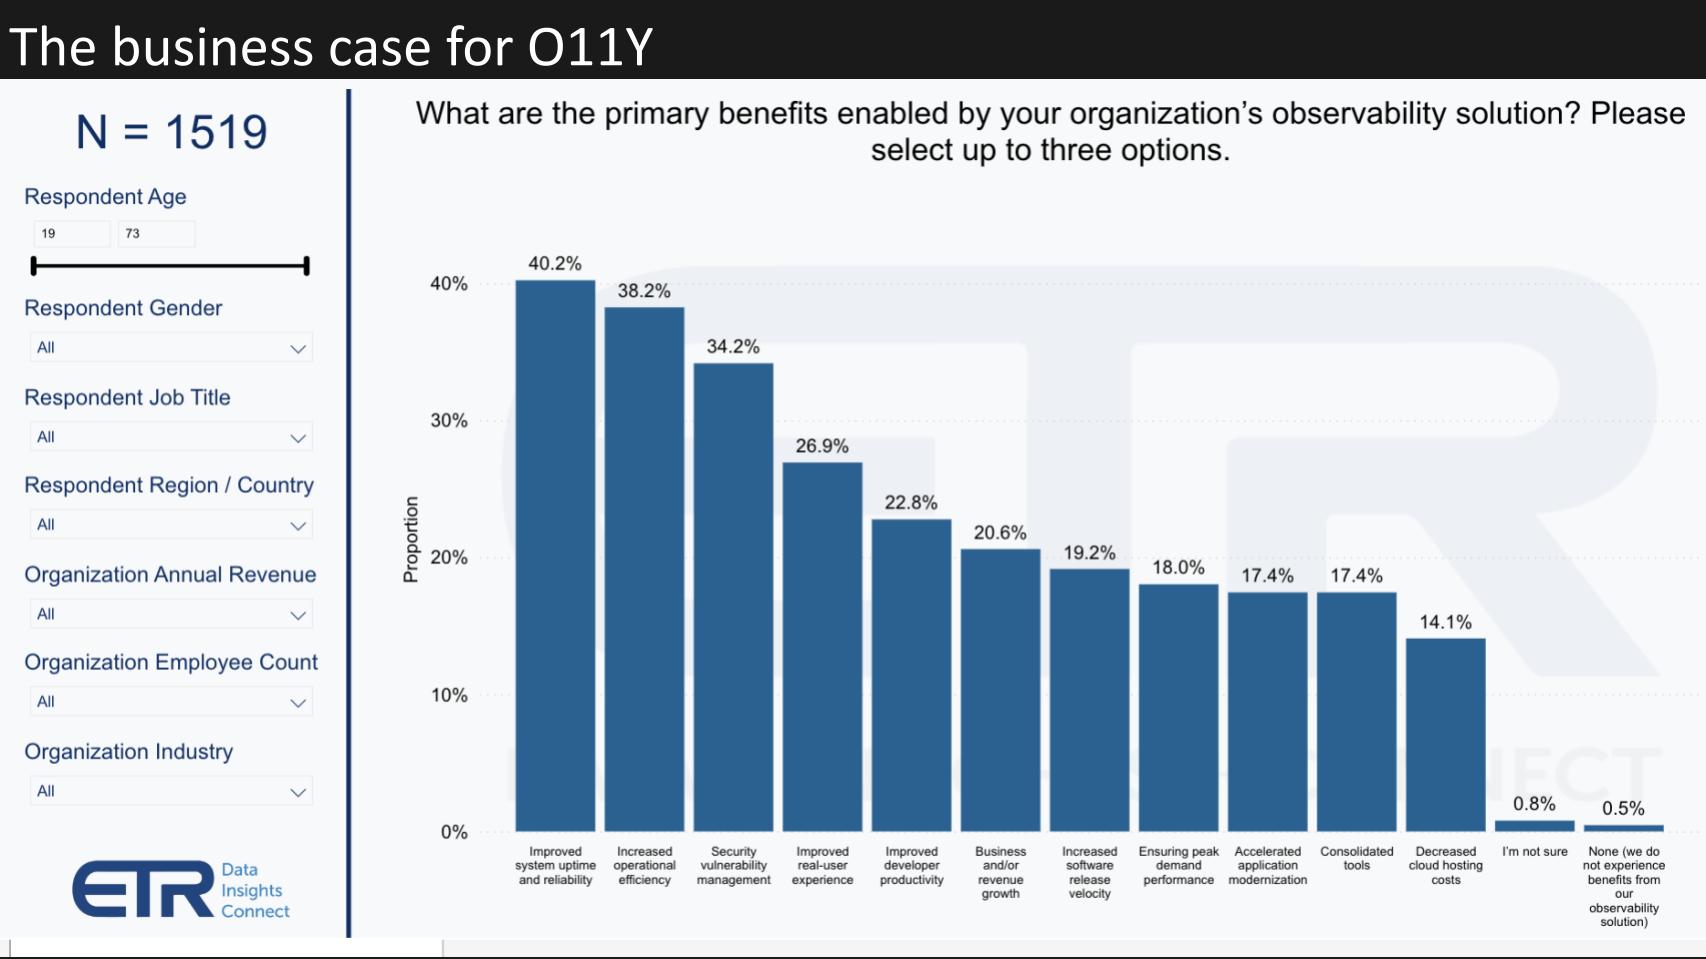
Better uptime, improved efficiency, more secure environment, better customer experience, helps developers be more productive because they’re doing less troubleshooting, etc. And this ostensibly leads to greater business agility and more revenue. Only one half of one percent cited no benefit. This is across all roles, all geos and all industries by the way.
But there are challenges to adopting FSO including the siloed nature of data and IT, tools creep, lack of talent…but the #1 pressure is lack of budget – i.e. perceived as too expensive. So the industry has an opportunity to better sell the benefits.
Perhaps retiring goofy terms like O11Y would help!
FSO Trends to Watch
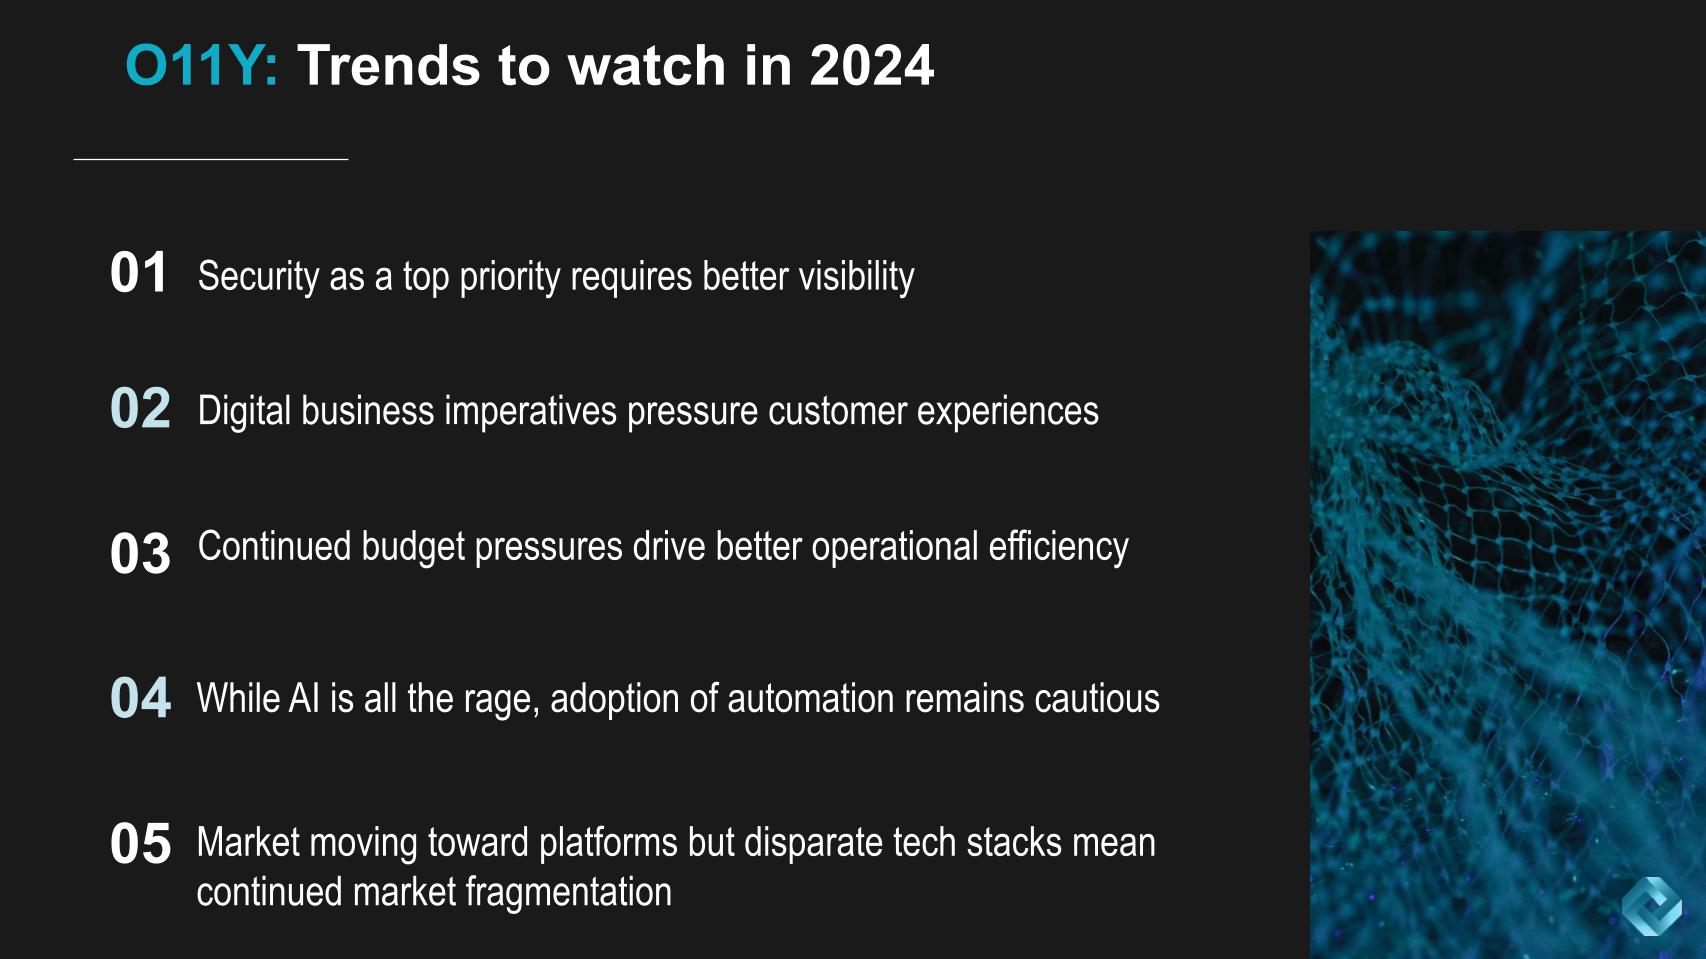
Security remains the #1 priority in the ETR survey data and that requires better visibility. So we don’t expect FSO to be a fad that fades in 2024. Just the opposite actually. As digital businesses fight for customers and access to real time data becomes more critical FSO will only grow in prominence in our opinion. The latest ETR survey data on the spending macro is showing some positive momentum for 2024 – but really toward the second half. Adam Selipsky said it best when he shared at re:Invent that we’ve seen better times, we’ve seen worse times, but we’ve never seen such uncertain times. True words of wisdom from the CEO of AWS.
Everyone is AI crazed – including us – but your practitioners are cautious and probably skeptical that they have job security. So part of your challenge is to convince the do-ers that AI will bring new opportunities and relieve them of mundane and tedious tasks. And you’ll have to also put in processes to make sure that automation doesn’t create boo boos because with the cloud and distributed computing…mistakes can travel fast.
The last point is clearly the market generally and full stack observability specifically is moving toward platforms. But the siloed nature of tech stacks, technical debt and sunk costs will mean a continued fragmented market. That said, those leaders with full stack capabilities, cloud native tooling and real AI will be in a good position to ride the consolidation wave in 2024 and beyond.
Keep in Touch
Thanks to Alex Myerson and Ken Shifman on production, podcasts and media workflows for Breaking Analysis. Special thanks to Kristen Martin and Cheryl Knight who help us keep our community informed and get the word out. And to Rob Hof, our EiC at SiliconANGLE.
Remember we publish each week on Wikibon and SiliconANGLE. These episodes are all available as podcasts wherever you listen.
Email david.vellante@siliconangle.com | DM @dvellante on Twitter | Comment on our LinkedIn posts.
Also, check out this ETR Tutorial we created, which explains the spending methodology in more detail.
Watch the full video analysis:
Note: ETR is a separate company from Wikibon and SiliconANGLE. If you would like to cite or republish any of the company’s data, or inquire about its services, please contact ETR at legal@etr.ai.
All statements made regarding companies or securities are strictly beliefs, points of view and opinions held by SiliconANGLE Media, Enterprise Technology Research, other guests on theCUBE and guest writers. Such statements are not recommendations by these individuals to buy, sell or hold any security. The content presented does not constitute investment advice and should not be used as the basis for any investment decision. You and only you are responsible for your investment decisions.
Disclosure: Many of the companies cited in Breaking Analysis are sponsors of theCUBE and/or clients of Wikibon. None of these firms or other companies have any editorial control over or advanced viewing of what’s published in Breaking Analysis.