RPA competitors vie for a bigger prize…
RPA Leads all Sectors in Spending Intentions
Robotic process automation (RPA) solutions remain one of the most attractive investments for business technology buyers. This despite our overall 2020 tech spending forecasts, which remain at the depressed levels of -4% to -5% for the year. Relative to previous surveys, we do see some softness in traditional RPA strongholds such as large financials, insurance and giant public and privates. But RPA relative to other technology investments remains at the top as the sector with the highest spending momentum – neck and neck with that of machine learning / AI, ahead of containers and ahead of cloud computing.
In this week’s Wikibon CUBE Insights, Powered by ETR, we want to update you on the latest RPA trends share fresh ETR survey data with our communities.
Key Points in this Segment
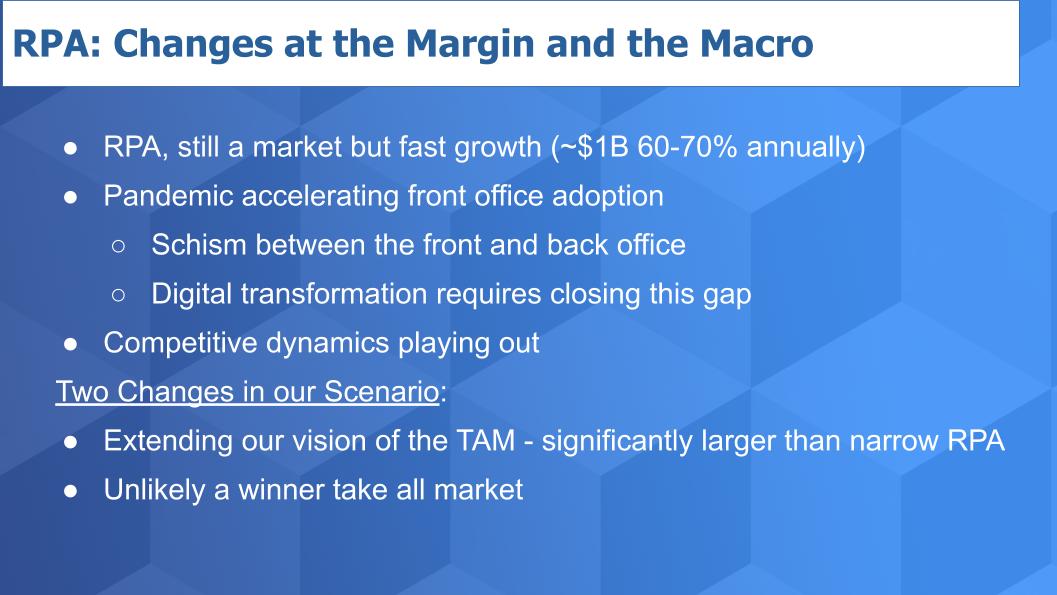
As mentioned, despite our tepid spending forecast for the year, demand for RPA software continues to grow at a 60-70% clip. Remember, RPA mimics human computer interactions using software scripts or robots that execute human tasks in a runtime assembly of discrete steps. The practice first became popular for back-office functions – mostly as unattended bots.
The pandemic appears to be accelerating front office adoption and this is creating a bit of a schism between front and back office processes, strategies and implementations. Digital transformation initiatives, in many ways, create the connective tissue between the front and back of the house. We see that connection as a lynchpin of digital efforts.
The Competition is Capable
Competitive dynamics are heating up. The two emergent leaders, Automation Anywhere and UiPath are separating from the pack. Large incumbent software vendors like Microsoft, IBM and SAP are entering the market and positioning RPA as a feature. Meanwhile, the legacy business process players continue to focus on taking their installed bases on a broader automation journey. However all three of these constituents are on a collision course in our view where a deeper automation objective is the “north star.”
Two Material Changes to our Scenario
First – we have expanded our thinking on the RPA total available market (TAM) and we are extending this toward a broader automation agenda more consistent with buyer goals. In other words, the TAM is much larger than we initially thought and we’ll explain why.
Second – we no longer see this as a winner take all or most market. In this segment we’ll look deeper into the leaders and share some new data. In particular, while it appeared in our previous analysis that UiPath was running the table on the market, we see a more textured competitive dynamic setting up and the data suggests that other players including Automation Anywhere and some of the larger incumbents will challenge UiPath for leadership in this space. As with many developing software markets, the ultimate leader is not crystal clear at this point.
The Effects of the Pandemic
Conventional wisdom suggests, and we agree, that the automation mandate has been accelerated by several years due to Coronavirus. Three points here: 1) Yes, COVID has put digital transformation on the front burner of executives’ priority lists; 2) Automation isn’t trivial and there’s a difference between wanting and achieving; and 3) We believe there’s another driver for the automation mandate which will survive a vaccine or herd immunity and that’s the productivity gap.
Human Labor Alone Can’t Solve the World’s Biggest Problems
The chart below underscores this reality point and was first brought to our attention by author David Moschella.
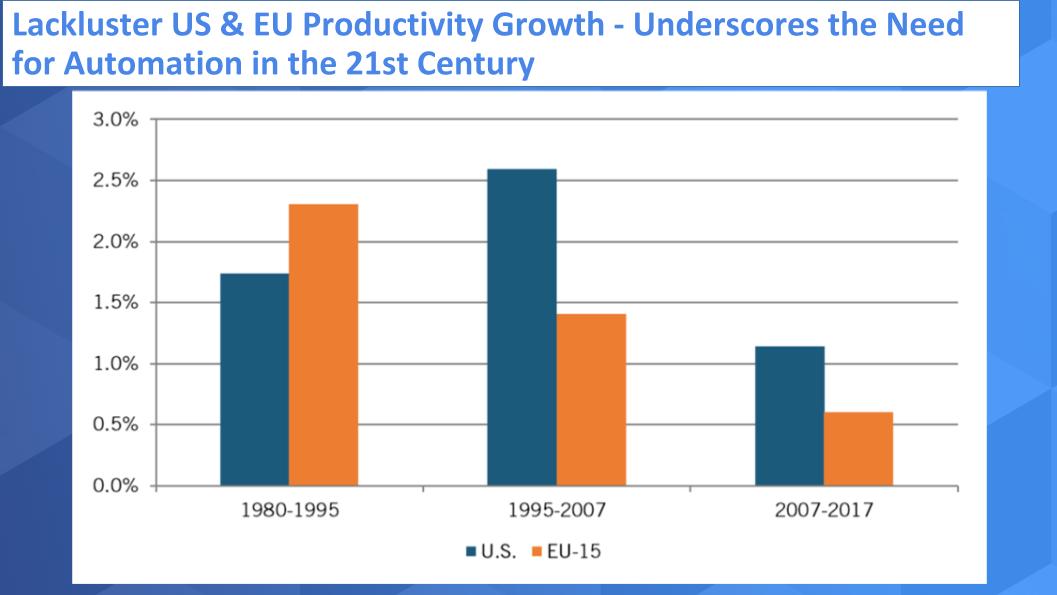
Specifically, we’ve seen a noticeable decline in productivity in the US and EU since the personal productivity boom brought forth by the PC and Internet. The premise put forth by Moschella is that in order to solve the grand challenges of the 2020s and beyond, automation is a mandate. Climate change, global competitiveness, aging populations and infrastructure, massive deficits, mass immigration, sustainable food sources, healthcare will all require huge injections of automation into the system to solve problems associated with these areas. Human labor isn’t the answer.
New Thinking on the RPA Total Available Market
The diagram below updates our expectations on the TAM for RPA. The first takeaway is we envision a market for business automation – well beyond software bots, which are represented in the first two layers. That back office and front office divide if you will. And we see those two coming together in the third layer through digital transformation initiatives. But we also envision a massive market for automated decision making and very deep business integration where systems are communicating to each other and making real time decisions.
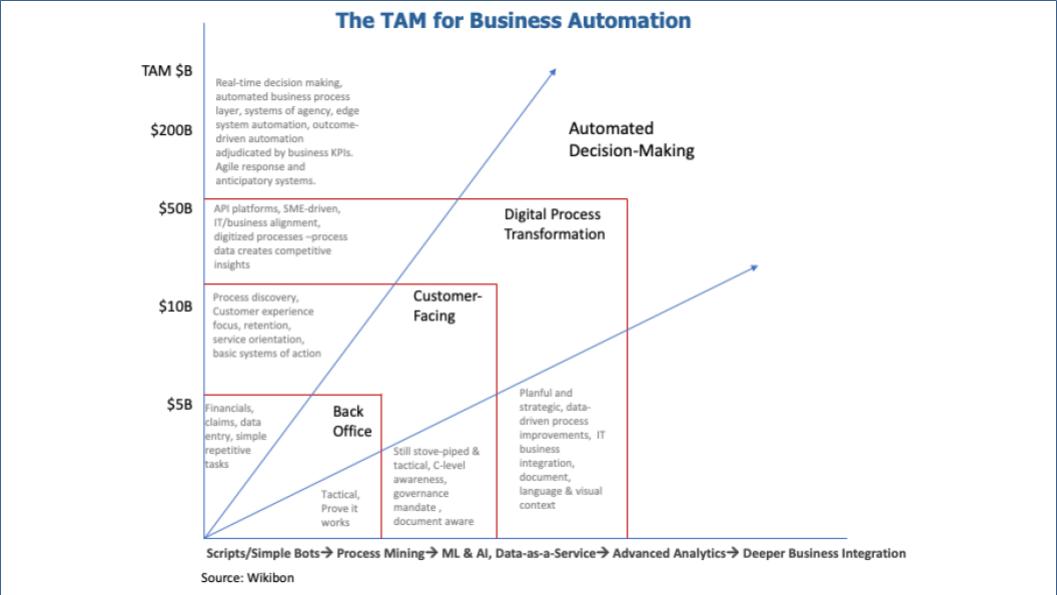
We’re not going to go deep into this as it’s a bit academic but suffice to say this is an enormous market comprising many layers of the tech and services stack. And this presents serious opportunities for multiple players.
RPA Spending Survey Data
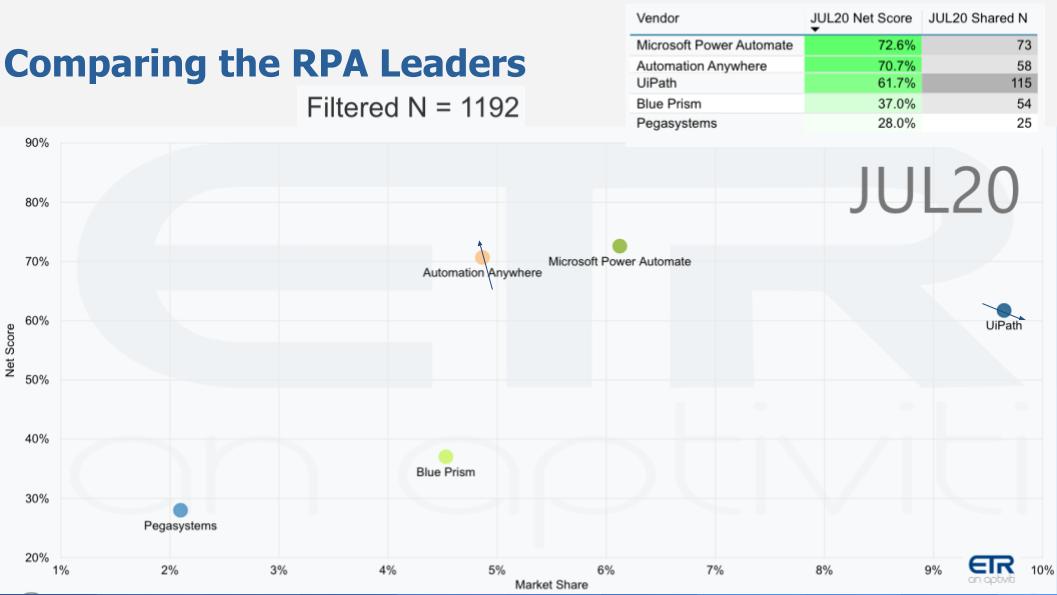
The chart below is one of our favorites because it plots two important metrics – Net Score (spending momentum on the Y-Axis) and Market Share (pervasiveness in the survey – on the X-Axis) for the RPA leaders. Net Score is a simple but effective measure that for this last survey asks buyers are you spending more or less in the second half of the year than you had originally planned? Net Score is derived by subtracting the lesses from the mores and is shown in the upper right of the chart in the green highlights. Note the total N in the survey is 1,192 and you can see the number of responses for each vendor in the upper right in the gray. We eliminated any RPA vendor that didn’t get at least 25 responses.
Net Score: Automation Anywhere and UiPath Trade Places
And you can see on the X-Axis that Automation Anywhere and UiPath have essentially traded positions from our last update. This indicates that relative to the first half of 2020, Automation Anywhere customers expect greater spending momentum in the second half of the year than UiPath customers. UiPath at a 62% Net Score is still very high but this marks the first time since our reporting that AA has taken the Net Score lead. And the small arrows show the general direction of their respective momentum, which we’ll drill into later.
On the chart you can also see Blue Prism and Pegasystems and while they’re significantly below Automation Anywhere and UiPath, these are respectable Net Scores for more mature players. Again, we don’t consider these two to be RPA specialists. Especially Pega. The company has established an automation play well beyond RPA and has built an awesome business. In many ways they are benefiting from the hype being created by the newbies. We are in awe of the business that Alan Trefler and his team have built. This is a company with $1B in revenue and a valuation over $9B. The stock’s near its all time high and they took the company to IPO with no outside capital. Impressive.
One more thing on this chart. You can see Microsoft with Power Automate crashing the party with a 1.0 product that is making some noise.
[Note of caution: Net Score is a forward looking metric and measures spending momentum relative to past actuals or past expectations, depending on the time of year the survey is administered. For the July survey, ETR asks about second half spending expectations relative to the first half. While a higher Net Score is a sign of strength, readers must consider that if spending was soft in the first half, a company may show elevated Net Score levels as a result of an easier compare. The reverse is also true – in other words if a vendor had strong spending in H1 it may have a more difficult compare in H2 presenting a Net Score headwind].
Market Share Favors UiPath in the Survey
On the X-Axis you can see UiPath has the Market Share lead but we want to remind you what this is. Market share is an indication of pervasiveness in the survey and is calculated by dividing the number of mentions for a vendor in a sector by the total mentions in the survey. So you can see that UiPath has the share of voice lead but is still under 10% of the total survey base…so lots of room for this market to grow.
We want to make an important note because UiPath has historically been a collection of point products with a big emphasis on simple end user adoption. Whereas Automation Anywhere’s go to market typically involves going into large accounts and selling an end-to-end digital transformation initiative to the line of business. As we stated earlier – these two and other companies are on a collision course because that is the big prize. UiPath has restructured its product and pricing strategy to go after this larger scale opportunity. But it stands to reason that UiPath has a bigger presence in the ETR data set due to its heritage. This makes Automation Anywhere’s #1 Net Score position even more impressive in our view.
The other nuance is that ETR tends to be somewhat weighted to the IT side of the house and although it most certainly picks up line of business spending there’s a bias in the data. So that means RPA is most likely even stronger in the context of spending initiatives – and it’s already #1 relative to other sectors.
How Net Score has Changed for the Leaders
The chart below shows the change in Net Score or spending momentum for Automation Anywhere, UiPath, Blue Prism and Pegasystems over three survey periods, including last October, this April at the height of the U.S. lockdown and the most recent July survey.
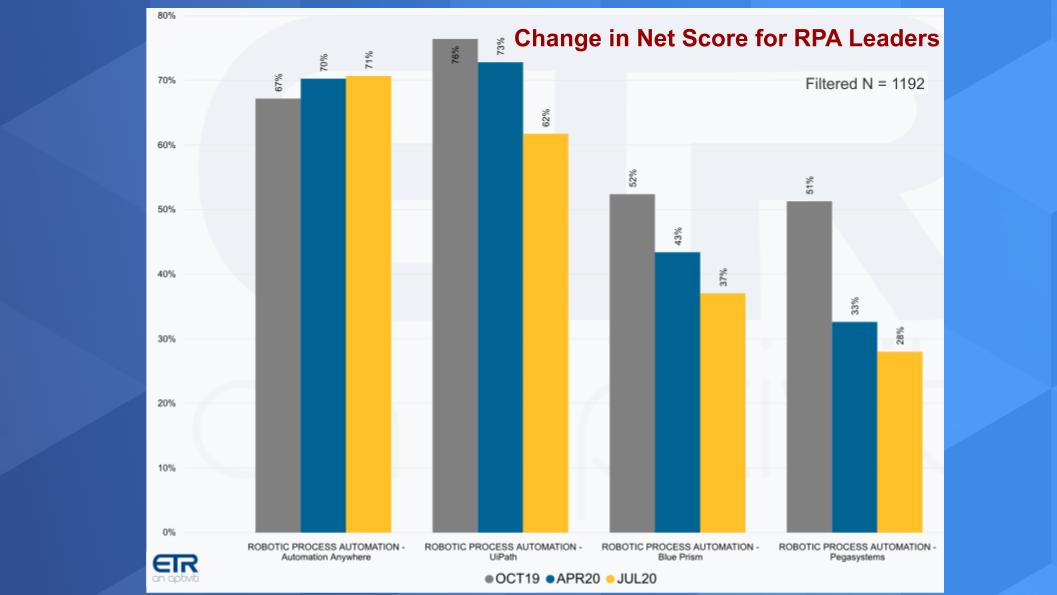
Here you see that Automation Anywhere is accelerating and taking the lead over UiPath and is the only one on the chart growing Net Score. Again, UiPath remains elevated despite the relative decline from previous surveys. The other two we have to caution you again that Pegasystems for example is crushing it in the market. The stock is up nearly 40% YTD and over 60% for the last 12 months. So because they are not so RPA-only focused and they really are not an IT play per se, the survey data has to be digested in that context. But you do see Pegasystems coming down from elevated levels last October.
A Time Series View of Net Score
This next chart below simply extends the timeframe and shows more granularity of survey data back to January 2018… so 11 quarterly survey snapshots. This really underscores the power of the ETR platform and you can stretch the data over time.
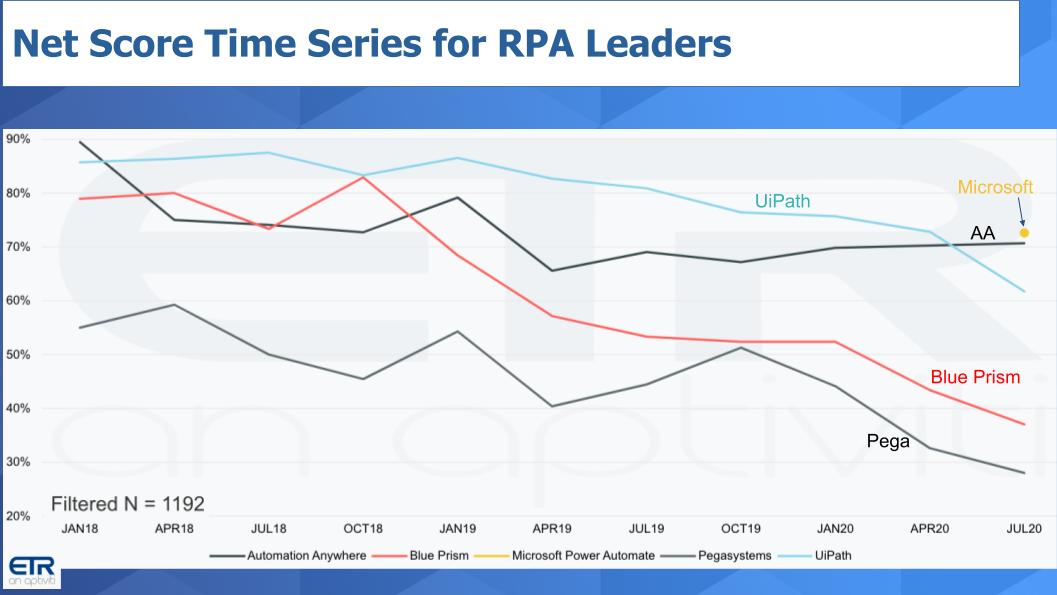
You see Automation Anywhere overtakes UiPath for the first time since we started capturing the segment. UiPath and the others show a noticeable decline in Net Score this survey. Microsoft is an exception as it just started showing up in the data and we stated is elbowing its way into the market.
A Time Series View of Market Share
This next chart below shows our other favorite metric, Market Share or pervasiveness in the data set over a time series.
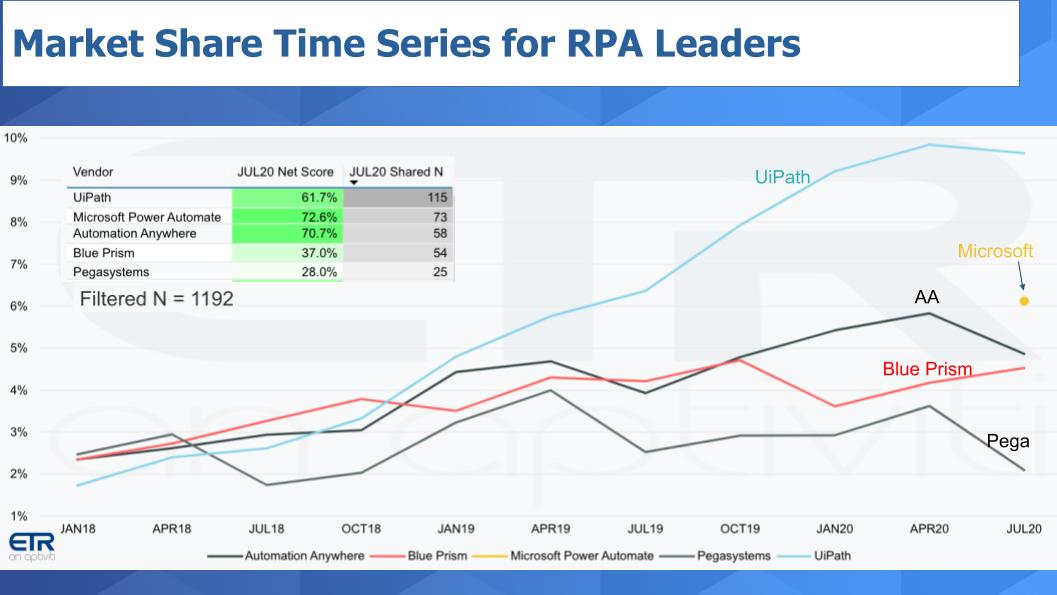
Remember this data is based on mentions so it’s not an indication of spending amount. But it is a data point and we pay attention to it. You can see how UiPath broke away from the pack in October 2018 and that coincides with the company’s big push on events (UiPath Forward) and training. The company has really have done a good job of building its presence and awareness in the market.
Note that we’ve superimposed the chart in the upper left corner for context. It shows Net Scores in the green and Shared N in the gray and is sorted on Shared N. This refers to the number of mentions in the data set for each vendor out of the 1192 total responses. So some of these have small Ns so we’re not going to put too much emphasis on this except that the UiPath escalation is notable and hopefully we’ve explained that sufficiently.
Big Market but the Real Money is with the Buyers
We discussed the automation mandate and the COVID wrecking ball effect. But it’s more than that – the productivity pressures on the U.S. and EU in particular make it exceedingly difficult to throw labor at the world’s grand problems.
So this has opened up an enormous opportunity for technology companies and practitioners to drive automation. We said this during the initial big data era – in fact Peter Goldmacher had this discussion with us on theCUBE in the early part of last decade. Those companies that can implement automation are going to be the big big winners. It’s not just the tech players. Of course as we’ve seen – many of the big tech companies are benefiting from enormously from mega automation but the broader set of industries has massive upside.
What this sets up is a multidimensional competitive environment. We have Automation Anywhere and UiPath battling it out to achieve escape velocity. Automation Anywhere just brought in Chris Riley to run go to market so you know they’re serious – he’s a player who understands complex enterprise selling…and UiPath is hiring engineers as fast as they can. And the other dimension is a classic battle of best-of-breed specialists like AA and UiPath against the bundlers selling automation as a feature of their services. Microsoft, IBM, SAP, etc. all see automation as a huge opportunity and everyone’s going to hop on the bandwagon because this is worth hundreds of billions of dollars. At least.
Thanks to our community and the input you provide to these segments. Please look for updates on the ETR Website and make sure to check out SiliconANGLE for all the news and analysis.
Remember these episodes are all available as podcasts wherever you listen.
Ways to get in touch: Email david.vellante@siliconangle.com | DM @dvellante on Twitter | Comment on our linkedIn posts.
Also, you may want to check out this ETR Tutorial we created, which explains the spending methodology in more detail.
Watch this week’s full video analysis: