UiPath’s recent $750M raise at a $35B valuation underscores investor enthusiasm for robotic process automation. And why not? The pandemic has fueled a surge in automation initiatives as organizations re-tool their operations and prepare for a post-COVID environment. But reasonable people are asking – “is this market getting overheated?”
In this Breaking Analysis we’ll explore the current trends in the RPA market and try to address the question– is UiPath’s value supported by the ETR spending data, how will the RPA market evolve from a total available market (TAM) perspective and where do some of the other players like Automation Anywhere, Pegasystems and Blue Prism fit?
What’s new in RPA?
Digital Acceleration. We’ve all been beat to submission with the idea that COVID has accelerated the transition to digital. RPA is one of the many tech sectors that has benefitted from the pandemic. For most organizations, if you’re not a digital business today, you’re out of business and replacing labor with software is a major factor in the digital transformations that are taking place.
Valuation Skyrocket. UiPath has now raised about $2B and has value comparable to that of Snowflake at its IPO. Many are predicting that UiPath will in fact be the Snowflake of 2021. While we’re optimistic about the future of UiPath, its operational track record probably doesn’t compare to that which Frank Slootman (CEO) and Mike Scarpelli (CFO) have brought to Snowflake. That said, the market conditions are good for UiPath right now.
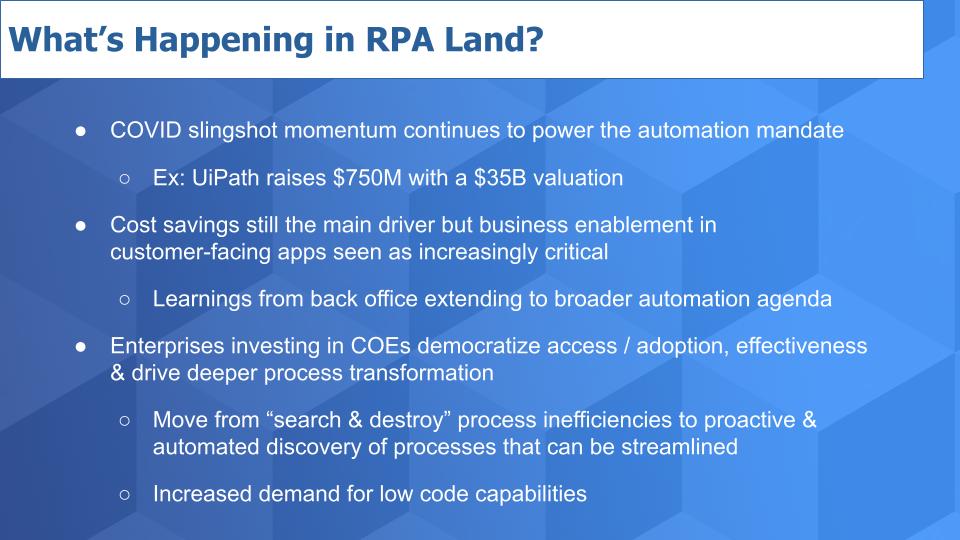
Beyond Cost Reduction. While cost reduction is still the main drive for RPA adoptions, we’re seeing more business productivity use cases that point to a broader automation agenda than simply installing some software robots in point applications to eliminate mundane tasks. Rather we’re seeing much more holistic thinking at organizations, in a large part driven by the COVID slap in the face. It’s given CEOs a green light to make big changes that would have been culturally much more difficult pre-pandemic.
RPA COEs. We’re seeing many more centers of excellence (COEs) pop up around RPA with a more aggressive agenda. Pre-COVID, these efforts would be met with more resistance to change than we’re seeing today. In the coming decade, we expect two major trends to emerge from these COEs: 1) A move from a “search and destroy” mentality toward process transformation to more of an automated approach toward discovering candidates for automation; and 2) Low code implementations will lead to the rise of the so-called “Citizen Developer.” Capabilities in this regard today are nascent but we believe they will improve steadily over the next several years and lead to the democratization of RPA.
Are we in Bubble or is RPA the Next Big Thing?
The chart below depicts our attempt a while back to assess the total available market for RPA. Looking at the TAM estimates and considering UiPath’s valuation we have to ask – what are we missing?
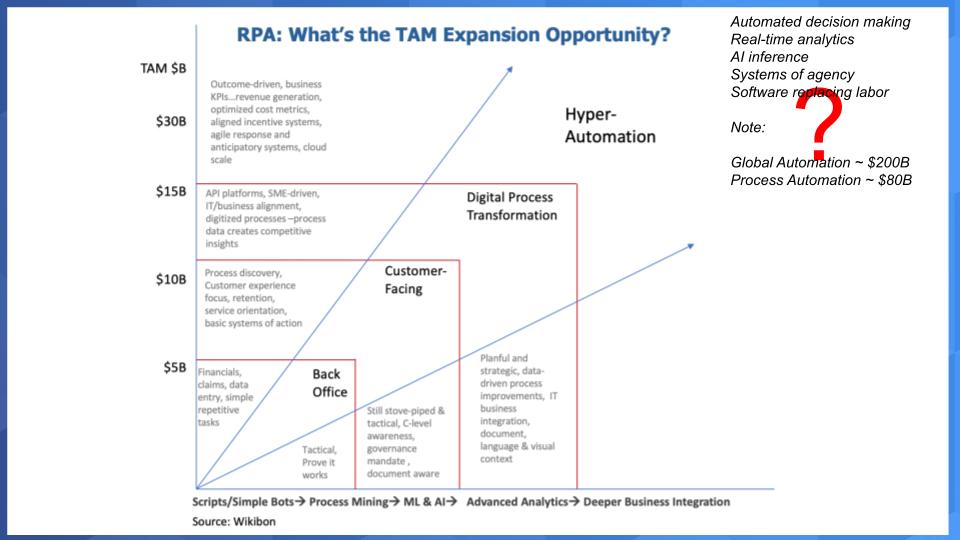
There are a few important points here. First our effort was somewhat narrowly focused on RPA tooling, but we did try to take into account a broader automation agenda across enterprises. We tried to size the move from back office to front office to enterprise-wide automation efforts leading to this buzzword called hyper-automation.
When we first published this chart we got feedback that we were too conservative and so we’ve thought about what we could be missing and that’s depicted in the red question mark. We need to do more work on this but looking at the global automation market we see a multi-hundred billion dollar opportunity. However that largely focuses on industrial automation versus replacing human business tasks with software robots. Process automation is a much smaller piece of that pie automation pie. And overall these larger figures include drones, autonomous vehicles and other innovations that RPA may not address.
Is it possible that there is an order of magnitude greater opportunity for RPA than we initially thought. Well here’s another way to look at it. RPA generally is targeted at larger organizations, which can justify the investment with fast returns. According to Fortune, the 500 largest companies in the world generate more than $30 trillion in revenue. Is it unreasonable to assume that they could spend 1% of revenue on RPA? We don’t think that’s crazy so there very well could be a TAM of hundreds of billions of dollars for RPA and its evolutionary forms.
We would say however, to attack that opportunity, point RPA tools won’t get us there…but automation platforms very well could. In fact that better be the case for UiPath and its peers based on current valuations.
So we’ll keep digging into that expanded opportunity to see if it holds water.
What Does the Spending Data Say About RPA?
As we’ve reported for many quarters now, RPA is one of the top areas in which organizations are investing; as seen in the chart below.
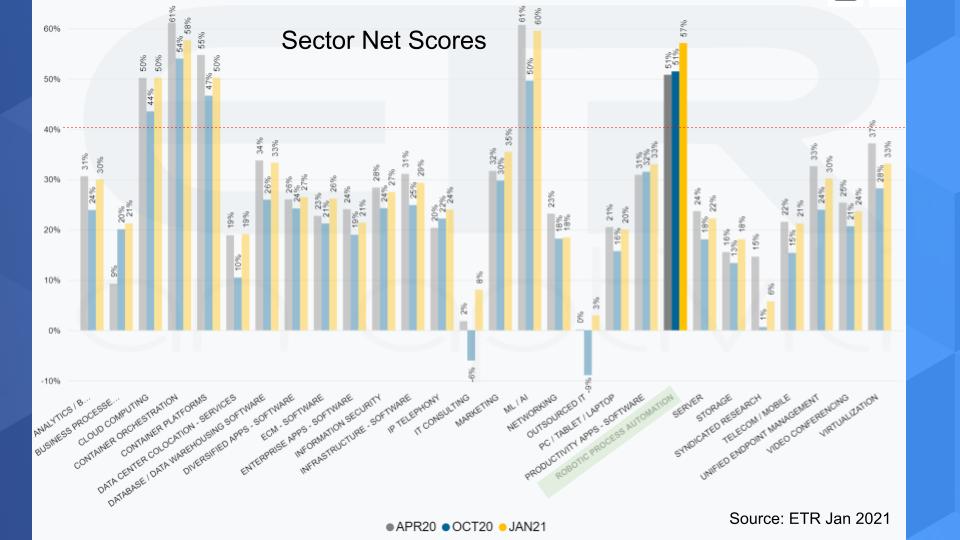
The graphic shows Net Score, or spending momentum across the ETR taxonomy. And you can see we’ve highlighted RPA, which along with ML/AI, Cloud and Containers, leads the pack. These sectors are the big momentum leaders and the four which have consistently shown a Net Score above that 40% red dotted line. An overall Net Score above forty percent for a sector, generally is viewed as elevated.
New Adoptions for RPA are Strong
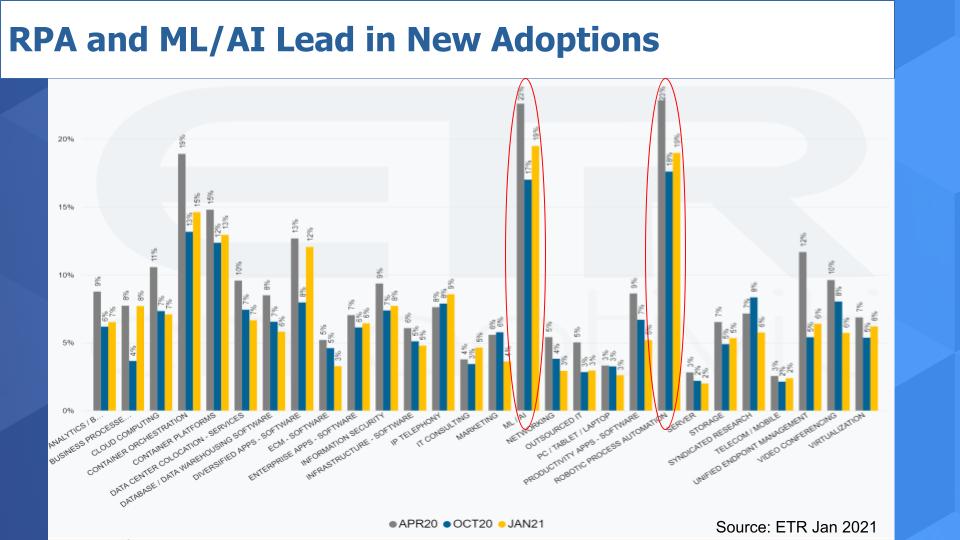
Remember that Net Score is a measure of spending velocity and is broken into a number of components that measure whether customers are spending more or less on a technology. One of the components of Net Score is New Adoptions – that’s part of the spend more equation.
The chart below shows only the New Adoptions across the sectors. And you can see RPA and ML/AI top the charts. The yellow bar shows the January survey results and you can see these two sectors are well ahead of the others in terms of new platform adoption.
RPA’s Overall Spending Profile is Accelerating
When we drill deeper into the spending profile for the RPA sector the story gets even better. The chart below shows the components of Net Score along with Market Share for the past nine surveys. The bright green on the bars is new adoptions, the forest green is the percent of customers spending more on RPA, the gray depicts flat spending, the pink is spending less and the bright red is replacing the platform. And the Net Score blue line at the top nets out the “spending lesses” from the “spending mores.” So you can see a highly elevated Net Score for the sector overall and holding well over time and is now increasing.
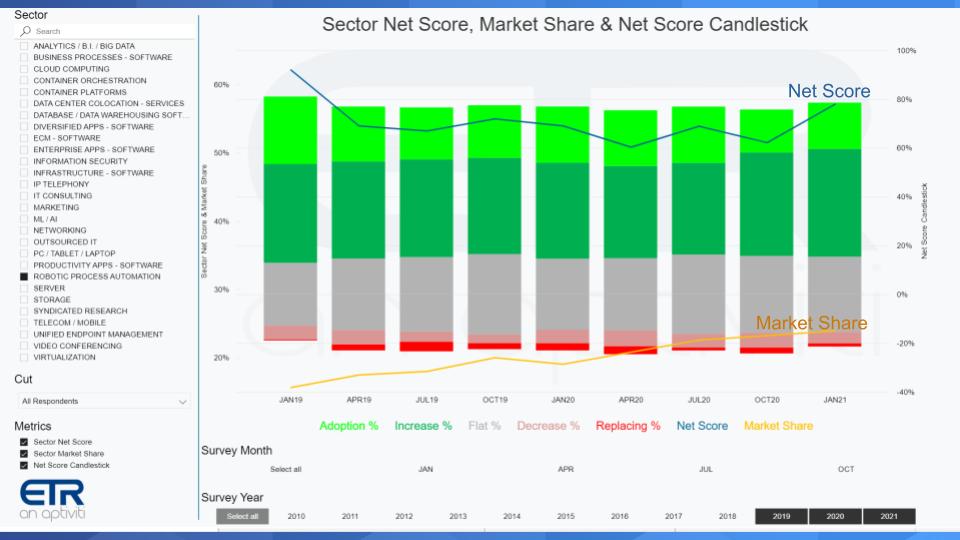
The yellow line at the bottom shows Market Share which depicts the pervasiveness of RPA within the overall survey, relative to other sectors. So the steady uptick over time suggests that buyers continue to allocate more and more budget to RPA– very positive signs here.
Top Vendors Show Strong Spending Velocity
The chart below shows spending momentum or Net Score over time for the five companies shown.
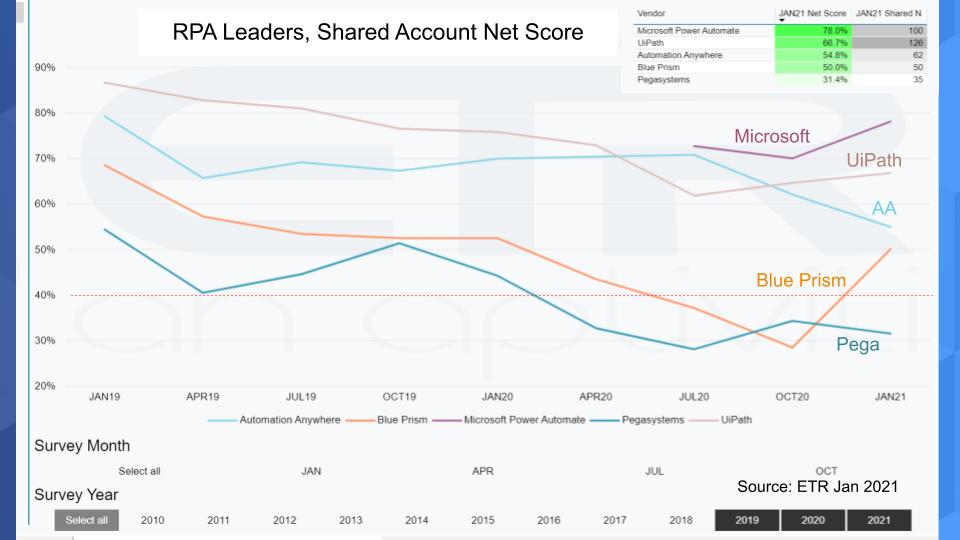
Microsoft. At the top of the chart is Power Automate from Microsoft, which last year acquired Softomotive and is integrating RPA into its offerings. Microsoft looms large as we’ve reported in so many sectors and RPA is no different. The reality is that Power Automate is not as mature as products from the leaders – a classic Microsoft 1.0 version. But Microsoft has entered the game now and can’t be taken lightly. We expect Microsoft to steadily improve its functionality and integration with the broader Microsoft portfolio…making it an easy choice for many Microsoft customers.
Note: While Microsoft leads in Net Score we look at its offering as an adjunct to Azure versus a pure RPA specialist. Good strategy but it leaves room for the other leaders to thrive in our view.
UiPath. You can see UiPath has retaken the lead in Net Score over rival Automation Anywhere and is showing a nice uptick from last summer’s survey. UiPath has been acquisitive and has expanded its portfolio enabling the company to move more toward becoming a platform play versus a point product. We’d also note three factors that favor UiPath, including: 1) Simplicity. UiPath is probably the easiest to adopt; 2) Its emphasis on and investment in training; and 3) Its very robust community and ecosystem.
Automation Anywhere. Automation Anywhere’s Net Score line is under pressure and we think that’s because the company essentially had to do a major product refresh and like any installed base migration, it will slow down momentum. But we think from a competitive standpoint it was the right move by AA. Bite the bullet, invest in the platform and grow from there. We felt the timing of AA’s refresh was particularly important given Microsoft’s entry into the market. Automation Anywhere also has a strong ecosystem and good engineering so we expect continued improvement for them going forward.
Blue Prism. You can see a big uptick for Blue Prism. It has a mature product and also touts a strong ecosystem. We’ve seen its momentum pop up and down and all around in the survey but they’re clearly a solid player in this market. Not the momentum of UiPath or AA but certainly a credible player.
Pegasystems. Pegasystems is really interesting. We don’t see them as an RPA specialist per se. They’re much more of a broader business process player and the company’s portfolio includes CRM and intelligent automation. RPA for Pega is a bundled offering that the company layers into its overall suite. We really like what the company has accomplished and feel they’re somewhat under-represented in the ETR data. We’ll come back to Pega in a moment.
Plotting Net Score & Market Share Emphasizes UiPath’s Lead
Below we plot Net Score on the Y-Axis and Market Share or pervasiveness on the X-Axis.
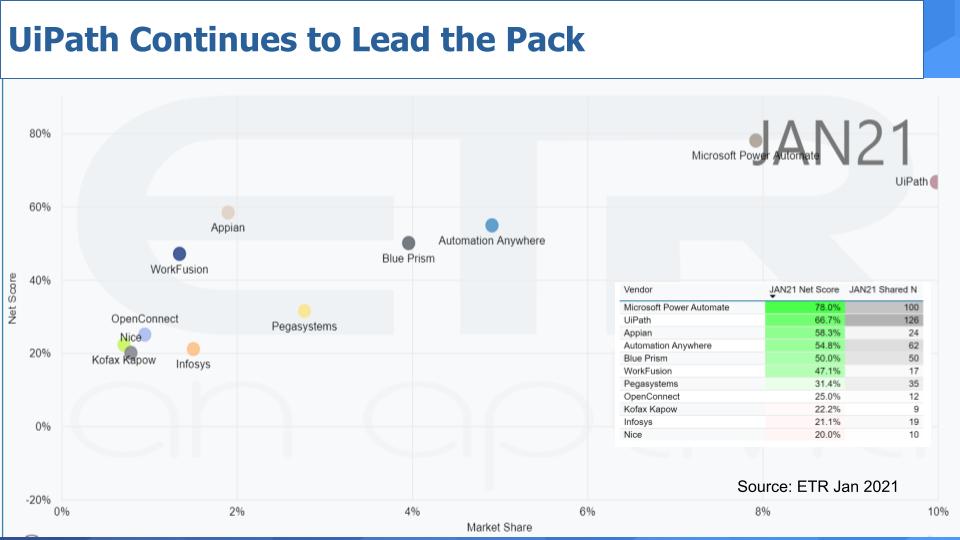
You can see above, UiPath is literally off the charts on the upper right with Microsoft looming large. Microsoft, UiPath, Automation Anywhere and Blue Prism all have Shared N’s or mentions in the survey of more than 50 and Net Scores over 50%. So those players stand out to us above the rest, with UiPath as the leader combining both the most significant market momentum and product excellence. Again, Microsoft is Microsoft and we would be foolish to minimize their presence. Now again, Pega is in the mix with a very respectable 31% Net Score but they are not an RPA specialist.
A Closer Look at Pegasystems
We really like the Pega story. The company is founder-led and has a long history of slow steady and impressive progress. It’s an old-school east coast success story with a survivor culture. The company’s strategy of focusing on a broader automation agenda across business lines is. The RPA froth, combined with Pega’s history, vision and solid execution are yielding steady returns for shareholders. It’s not high flying momentum play but we’re impressed with the company’s staying power.
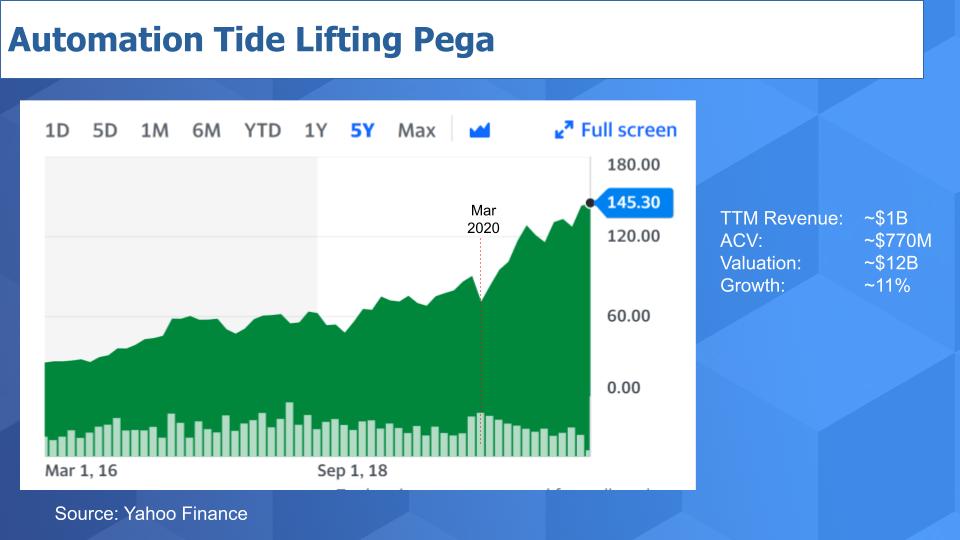
Above is a graph of Pega’s stock price over the past five years. And what’s most impressive is the strong upward move since March of last year. Pega is a billion dollar company that is moving to a subscription model and is doing a really good job of communicating to Wall Street. As it transitions to a recurring revenue stream it will have much more predictable cash flow and profitability. You can see its valuation, at $12B is about 12X revenue and significantly lower than that of UiPath’s most recent valuation by a factor of roughly 3X. Presumably due to its slower growth rate.
Nonetheless, Pega is taking advantage of the market momentum and continues to move its mature business forward. The company is thriving through a transition to a subscription model with solid growth, a strong customer base and a culture of innovation.
Spending Dynamics for UiPath & Automation are Positive
Let’s close by digging in deeper to the two pure play leaders, UiPath and AA. To do that, we’ll look at the wheel charts of each company.
UiPath
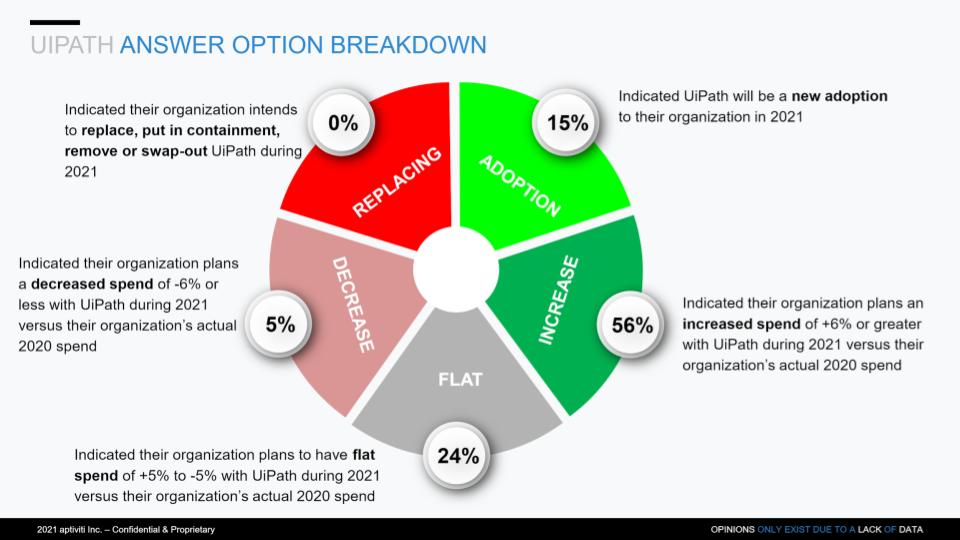
Above is a pie breakdown of what we described earlier regarding Net Score. Net Score is derived from this view by subtracting the reds from the greens. Several things stand out. First the large portion of new adoptions at 15%, supported by 56% of its customers spending more, only 5% spending less and 0% replacing. Very nice picture.
Automation Anywhere – New Adoptions are Encouraging
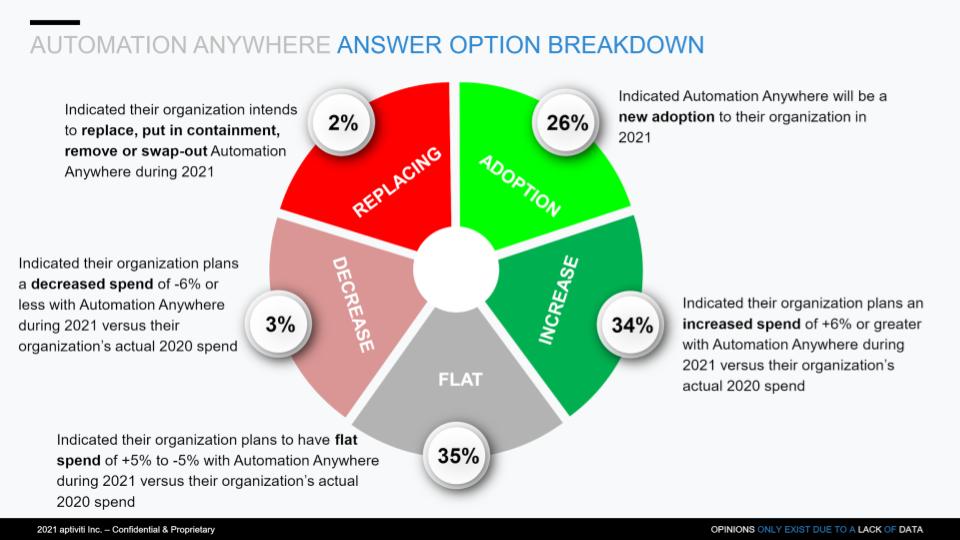
The chart above shows the same picture for AA. The data shows an even larger number for new adoptions– an encouraging sign that perhaps its new platform is resonating with prospects. Now AA’s Net Score is lower than UiPath’s owing to a much larger portion of the customer base that is flat spending and a slightly higher replacement figure. Again, these could be customers pausing spend as they prepare to migrate.
The bottom line is both of these companies exhibit strong spending patterns in the ETR data.
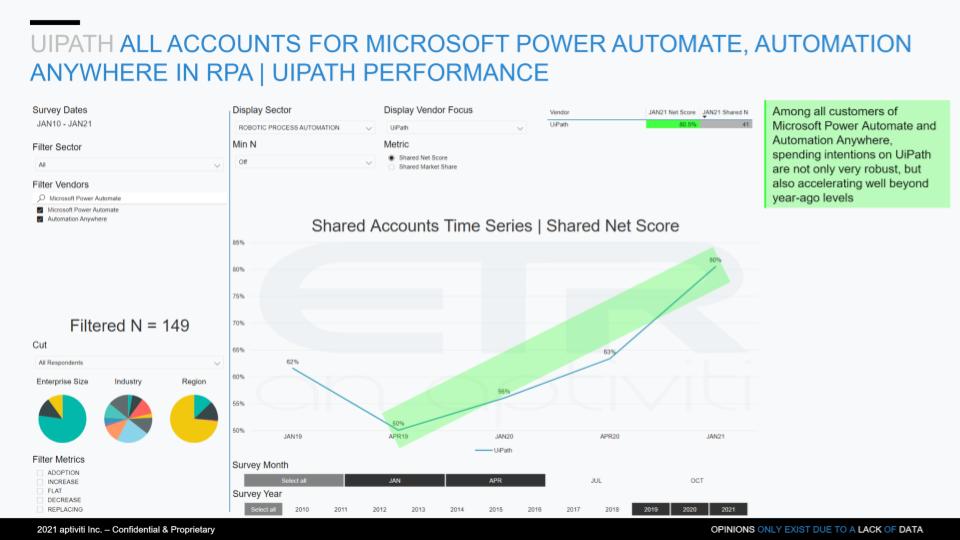
UiPath Thrives in Mixed Shops
We want to share one other data point that stands out. UiPath’s performance in organizations citing that they utilize multiple RPA vendors. And what stands out in the chart below is UiPath’s performance in these shared accounts. The chart isolates Microsoft Power Automate and AA accounts that also have UiPath installed. Out of 149 Microsoft and AA accounts, 41 have UiPath installed in the survey. And you can see the performance of UiPath since COVID hit in such filtered views. This is encouraging and speaks to UiPath’s strong go to market and its land and expand strategy.
By no means is this game over for the other players. It’s early days still in this relatively new era of RPA, even though the technology has been around for decades. The point is large companies have many divisions with buying autonomy and as such you see multiple RPA vendors within accounts. This trend will likely continue for some time but by the middle of the decade we would expect to see more consolidation.
The ETR data continues to align with where investors are placing bets, what customers tell us and anecdotal information in the marketplace. Specfically, that UiPath continues to pave the way for a new wave of growth, a well-funded Automation Anywhere is on its tail and these two are vying for leadership and are trying to break out. We expect public offerings for both companies within the next 12-24 months prior to Microsoft getting its product to a point that could really cause disruption to their respective businesses.
How do you see the automation trend generally and the RPA momentum in your business? Please let us know.
Ways to Connect
Remember these episodes are all available as podcasts wherever you listen. Check out ETR’s Web site. We also publish a full report every week on Wikibon and SiliconANGLE.
Ways to get in touch: Email: david.vellante@siliconangle.com | DM @dvellante on Twitter | Comment on our LinkedIn posts.
Stay safe and we’ll see you next time.
Watch the full video analysis:
Photo credit: iuriimotov