Premise
Flash-native storage will become a fundamental component of massively decentralized computing architectures, comprising distributed data, multi-cloud, heterogeneous compute, and intelligent edge networks. Wikibon believes that flash-native architectures will accelerate the adoption of next-generation, data-heavy, real-time workloads that transcend traditional analytics. The combination of real-time data analysis and faster transactions will transform business processes through previously unforeseen levels of automation. This transformation will be similar to how magnetic Hard Disk Drives (HDD) originally transformed tape-based systems and enabled real-time database transactions for systems of record.
Importantly, we believe flash native technologies will be the primary storage platform for valuable data and increase the value delivered by line-of-business departments by 30% or more through improved productivity and automation. We expect new and transformational business models to follow from the migration of asynchronous business processes to in-line real-time processes.
This research is broken into two sections:
- The first section deals with new flash form factors, which Wikibon calls native NAND flash storage, or Flash-native. This section also updates previous research on the impact of Covid-19 and other elements on when the cost per terabyte of NAND flash becomes less than HDD.
- The second section focuses on the IT business case and departmental business case for Flash-native file storage in the Big Data Mission in a mid-sized company.
Executive Summary
The Road to Flash-native Storage
Volume and the Magnificent HDD Era
Source: © Wikibon 2021
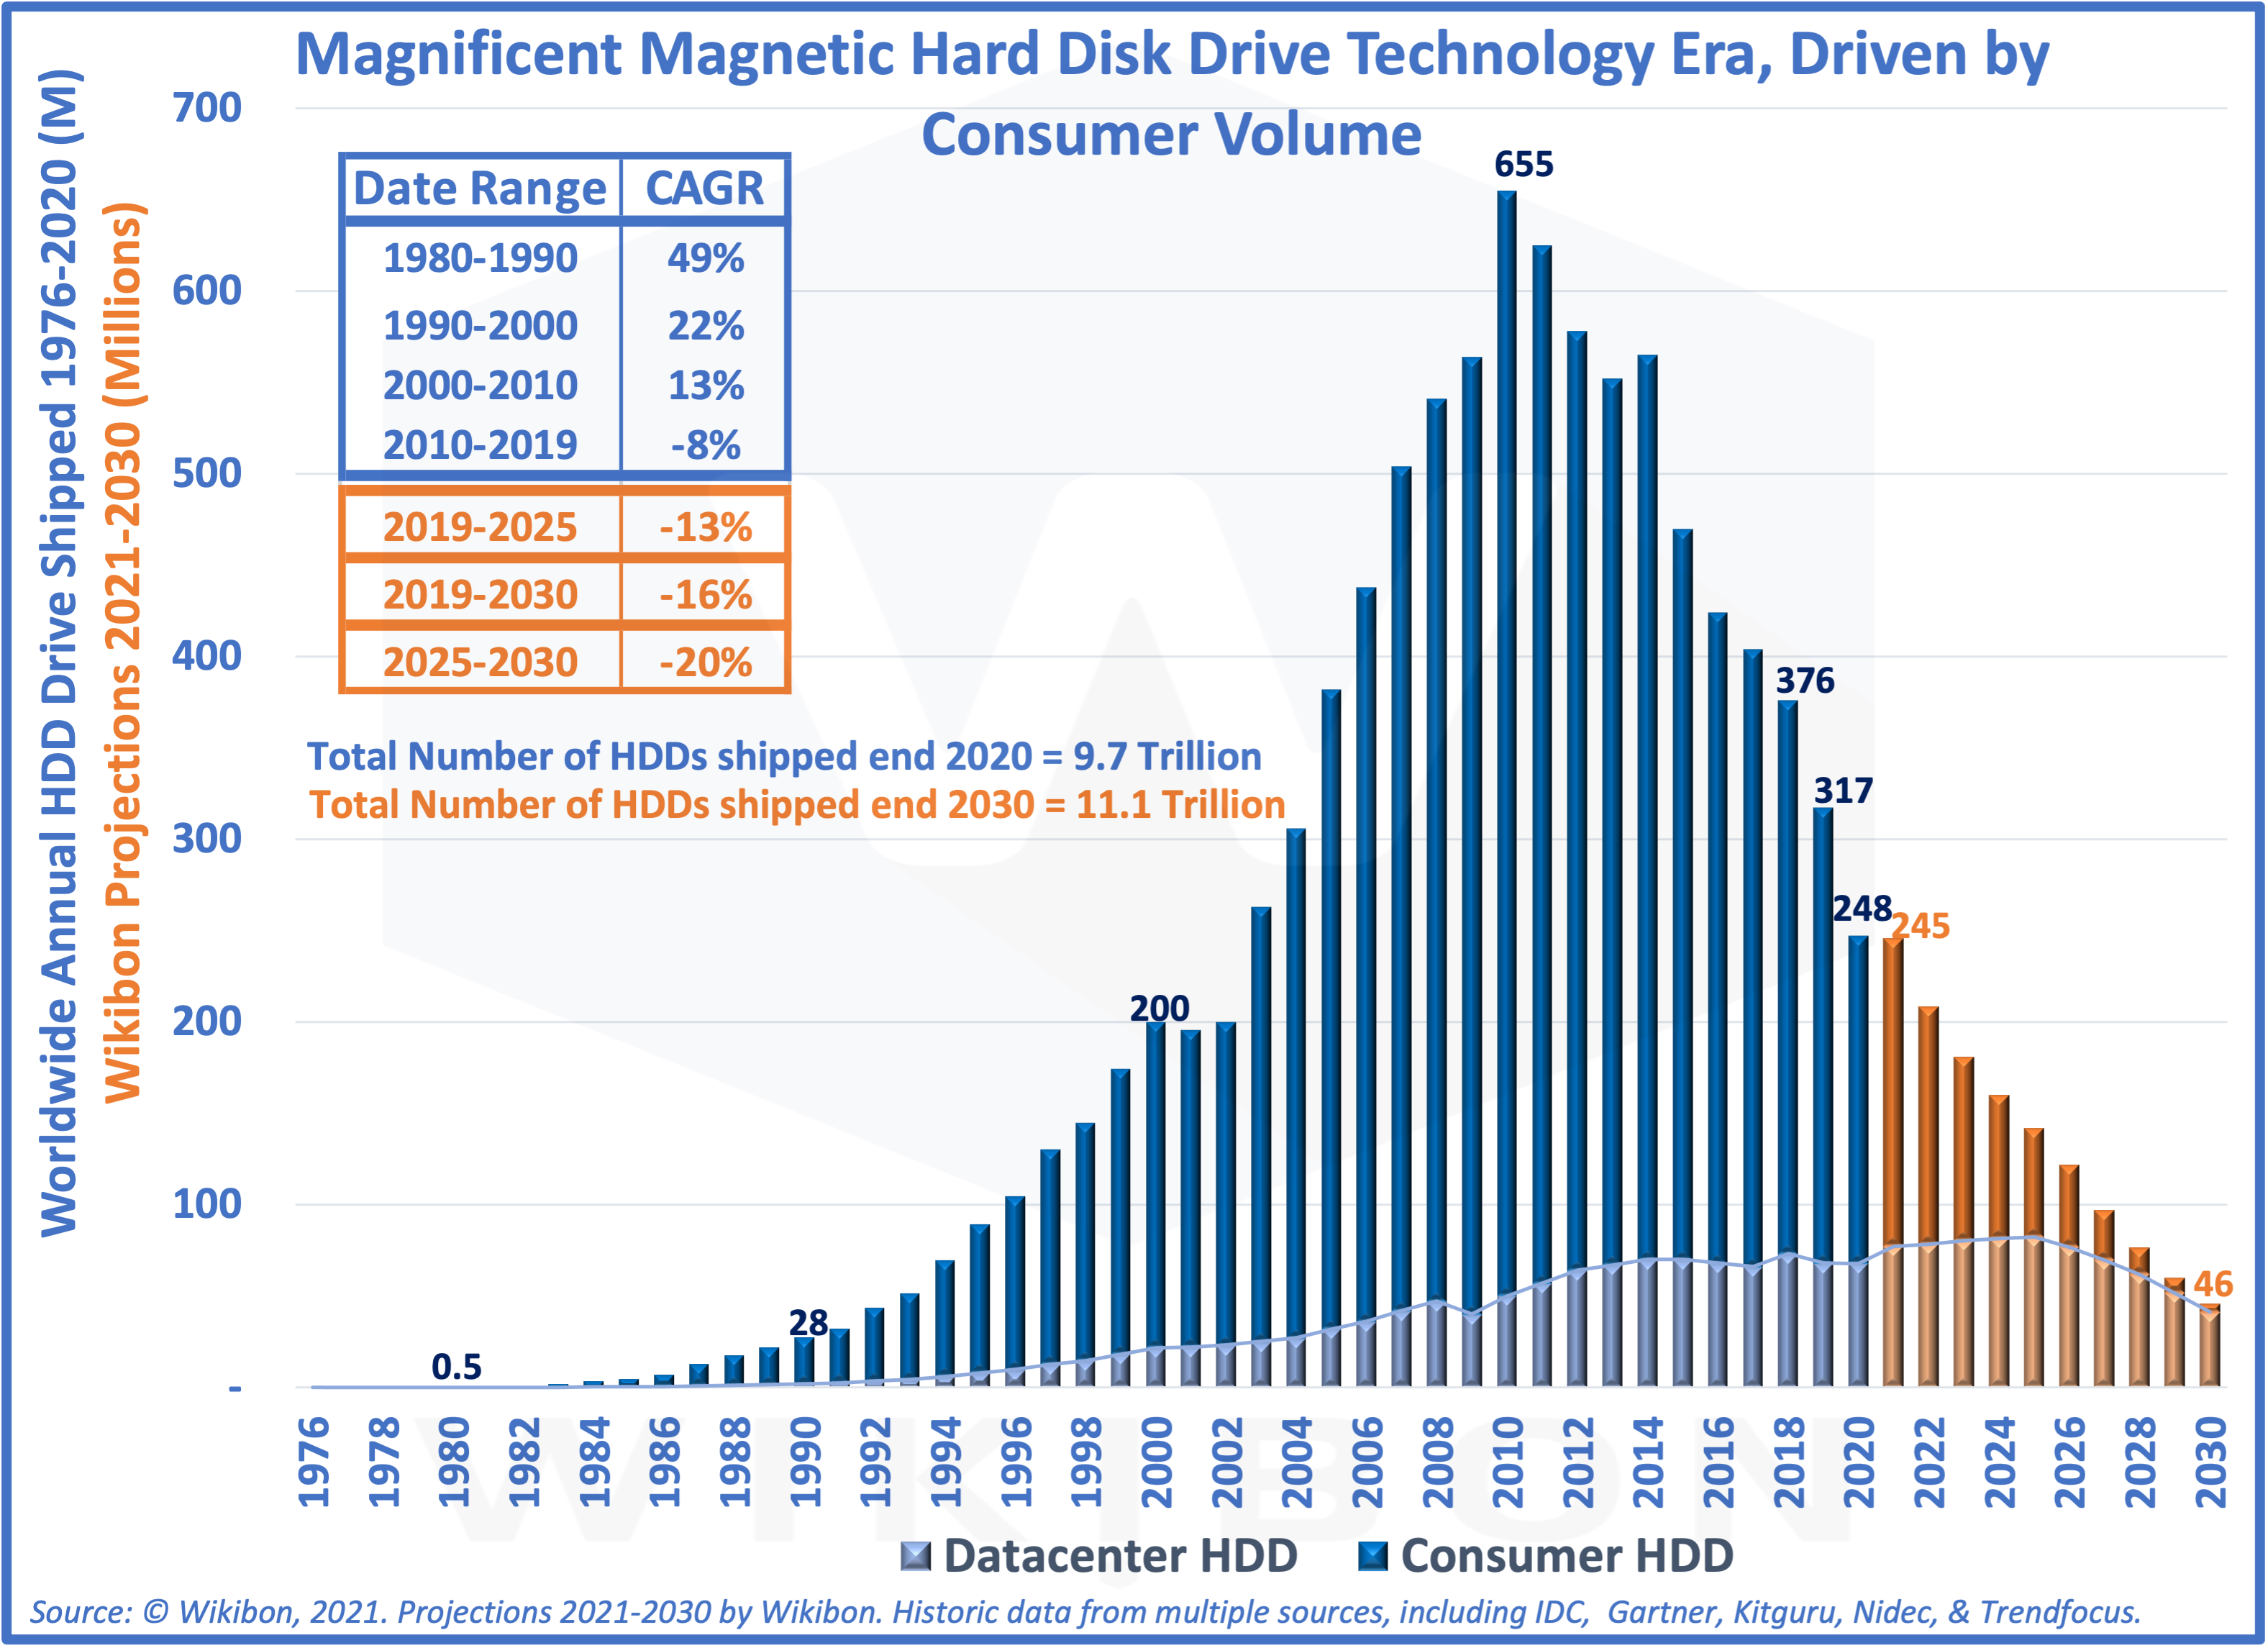
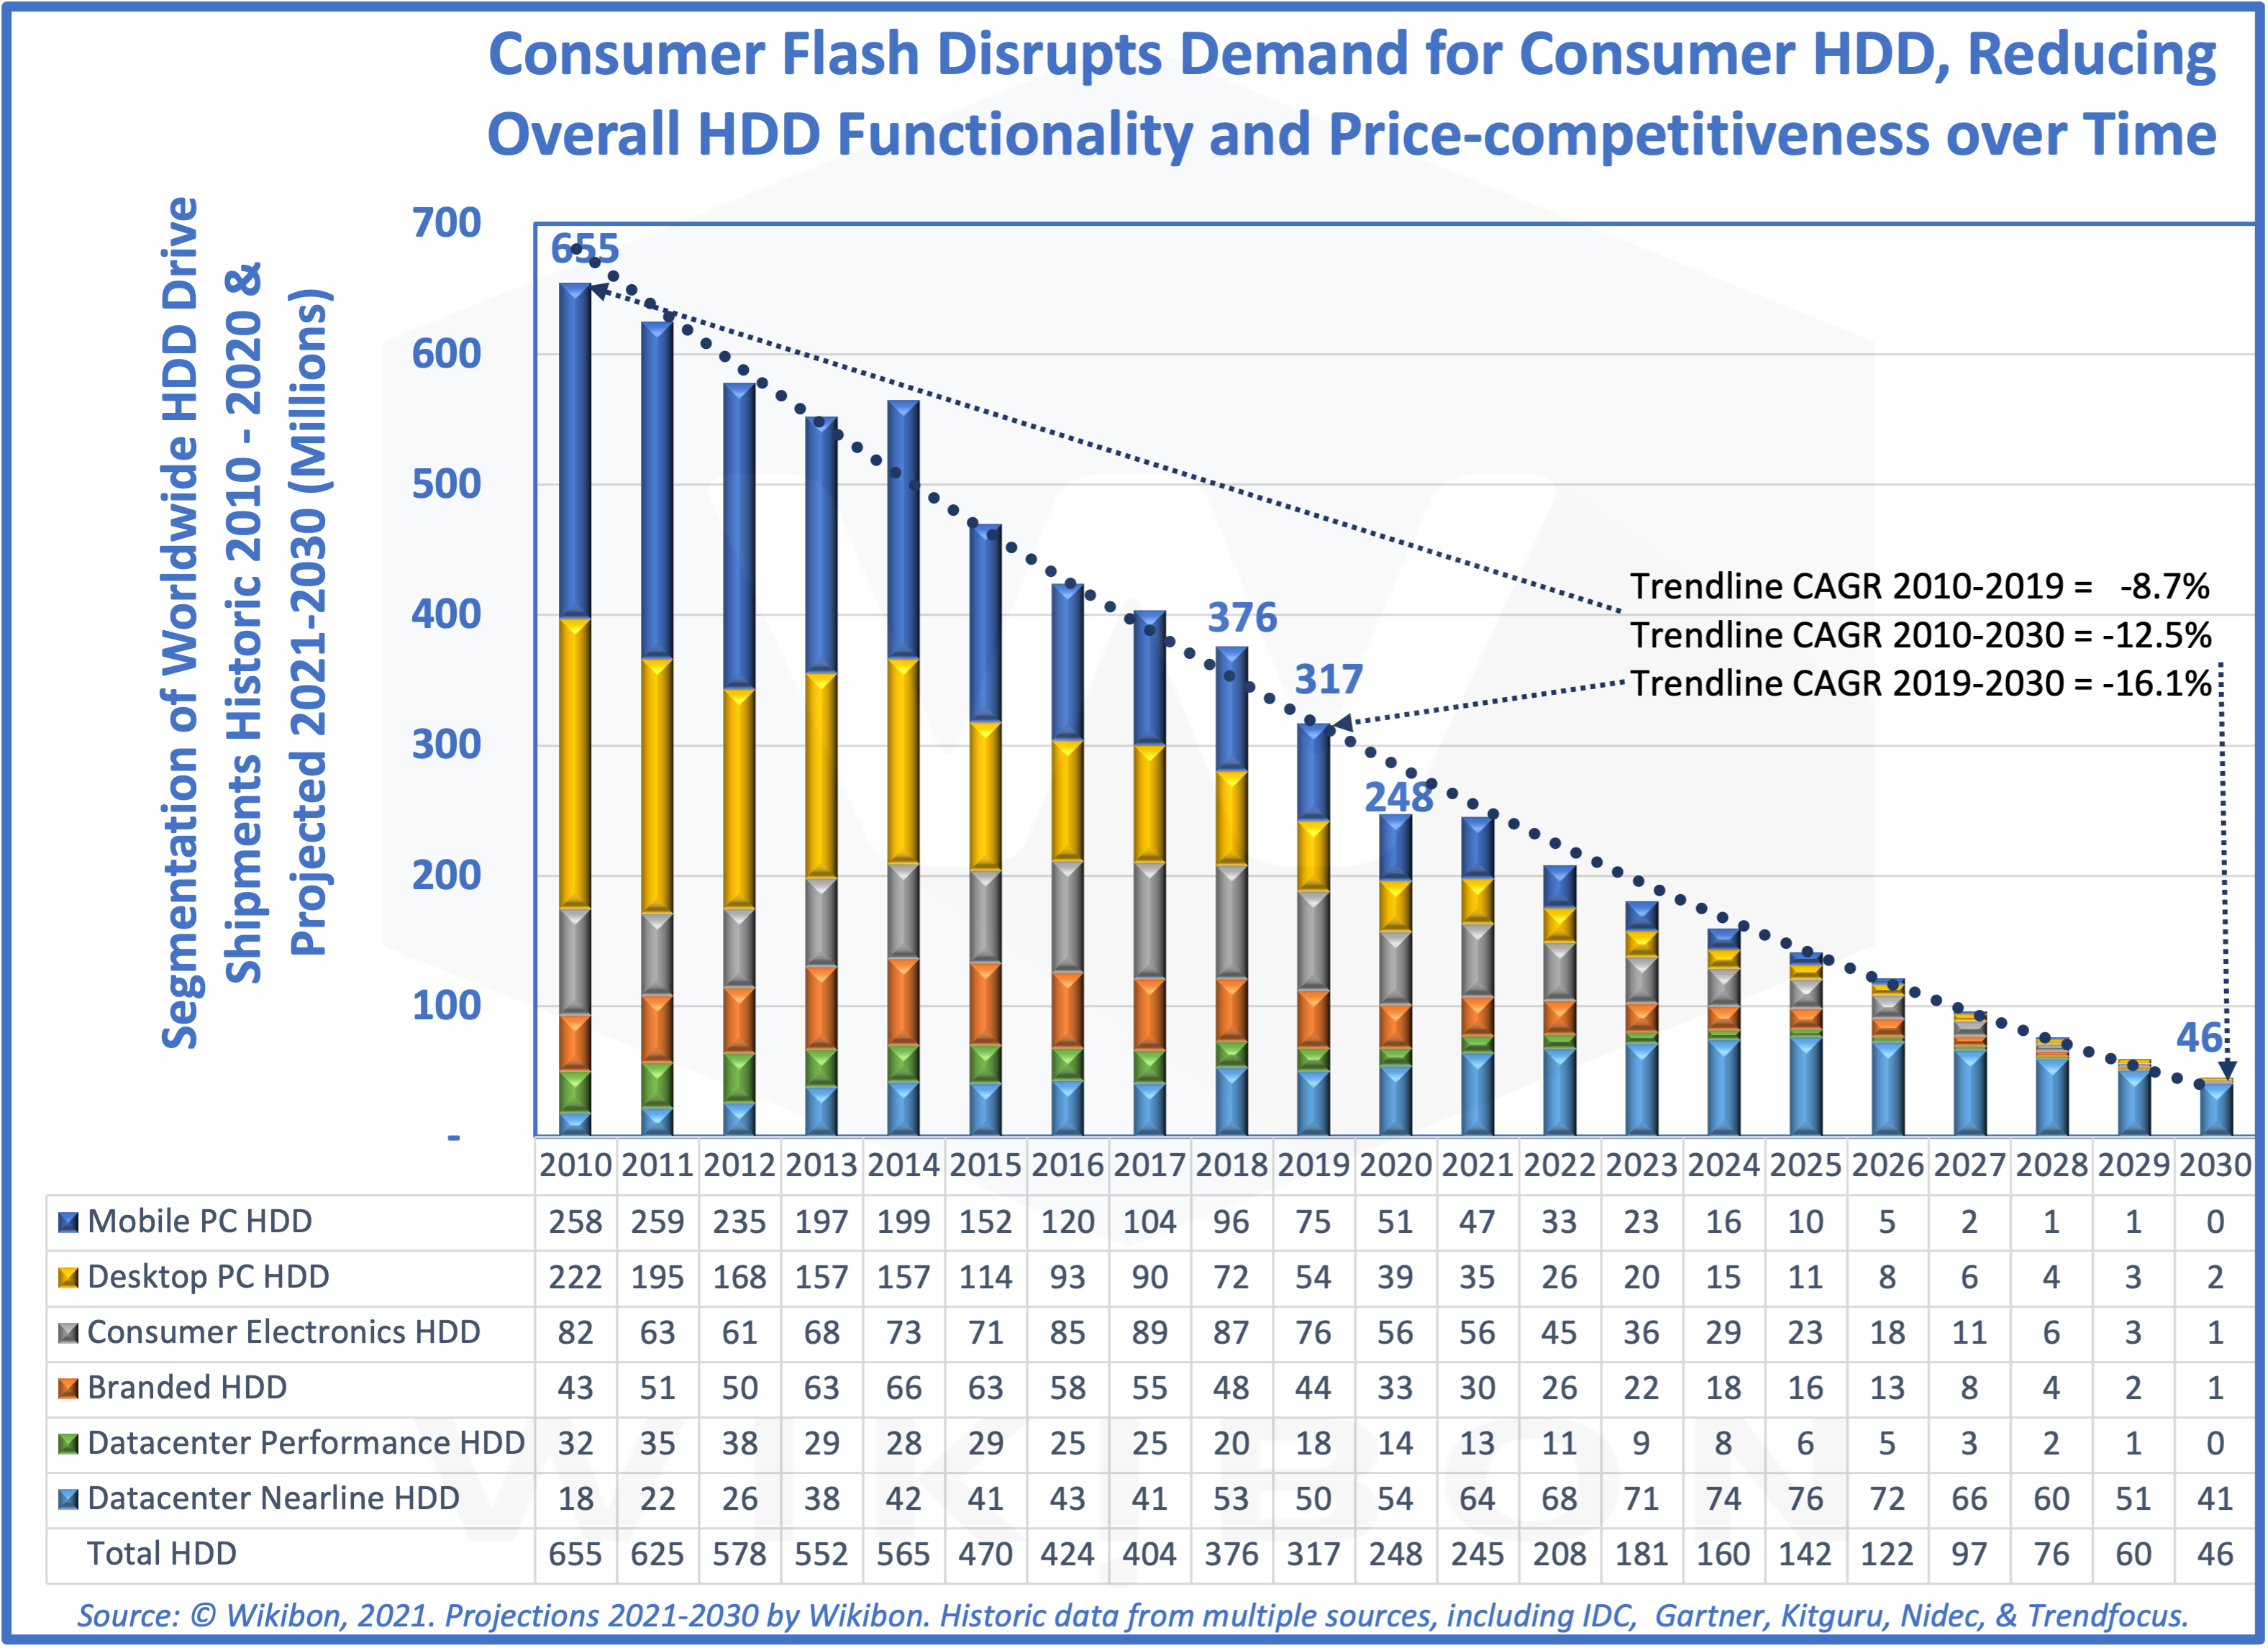
Figure 1 on the left shows “The Magnificent HDD Era” and how consumer HDD volumes with the PC drove HDD prices down and enabled rapid improvements in storage technology. The Figure 1 left-hand y-axis shows the HDD drive shipments in millions. The x-axis at the bottom shows the historic shipments in blue, and the Wikibon projected shipments for 2021 and later in orange.
The blue columns show the split between consumer HDD shipments in dark blue and the datacenter HDD in lighter blue. At the peak of HDD demand in 2010, 92% of shipped drives went to consumer products, mainly PCs. Thus, the consumer market drives HDD volumes. However, the crash in demand from the consumer market led to the decline in HDD shipments by over 50% from 2010-2019.
From HDD to SSD
Flash has always been more attractive to consumers than HDD. Flash is faster than HDD, takes less space, consumes less power, is more resilient when dropped, is quiet, and has no moving parts. In addition, it is simpler to engineer storage solutions with flash. The only negative issue for the adoption of flash is the high price of flash.
When Apple introduced the iPod Nano in 2006 and the iPhone in 2008, they were flash-only. PC vendors delivered this year (2021) over 60% of PCs with flash drives. In addition, consumers now use flash in the vast majority of consumer devices such as cameras, flash drives, etc. Many form-factors support consumer devices.
The same thing is happening with enterprise flash as happened with enterprise HDD. Facebook started using Fusion-IO flash storage in 2007. In 2008, enterprises began to adopt flash Solid-State Devices (SSDs) 2 years after volume consumer adoption in the EMC DMX-4. As consumer flash volumes lower the price of flash, enterprises have and will continue to adopt those technologies with about a 2-year lag.
From SSD to Flash-native
The majority of enterprises currently use SSDs, which use the same form-factor and protocols as HDD. The SSD protocols have been updated and improved with NVMe, but the SSD still has many similarities to HDD.
Vendors such are Pure Storage, and Edge device manufacturers have designed new Flash-native solutions from the ground up. For example, FlashBlade is designed and built by Pure Storage and is the reference Flash-native technology for this research.
Wikibon believes that a Flash-native approach, where the primary purchased ingredient is simply the flash chips, will lead to more flexibility and lower costs. In addition, Wikibon believes that the major cloud providers are also working on Flash-native storage solutions.
When Flash-native is Cheaper than HDD
The shipment volumes are still growing fast for flash, and as a result, HDD shipment volumes are dropping. The result of the high volume is that flash prices are falling by about 33% per year, and lower volume HDD prices are dropping by only 13% per year. This discussion is an executive summary of the greater detail in the “Price Projection Methodology Using Wright’s Law” section below.
Source: © Wikibon 2021
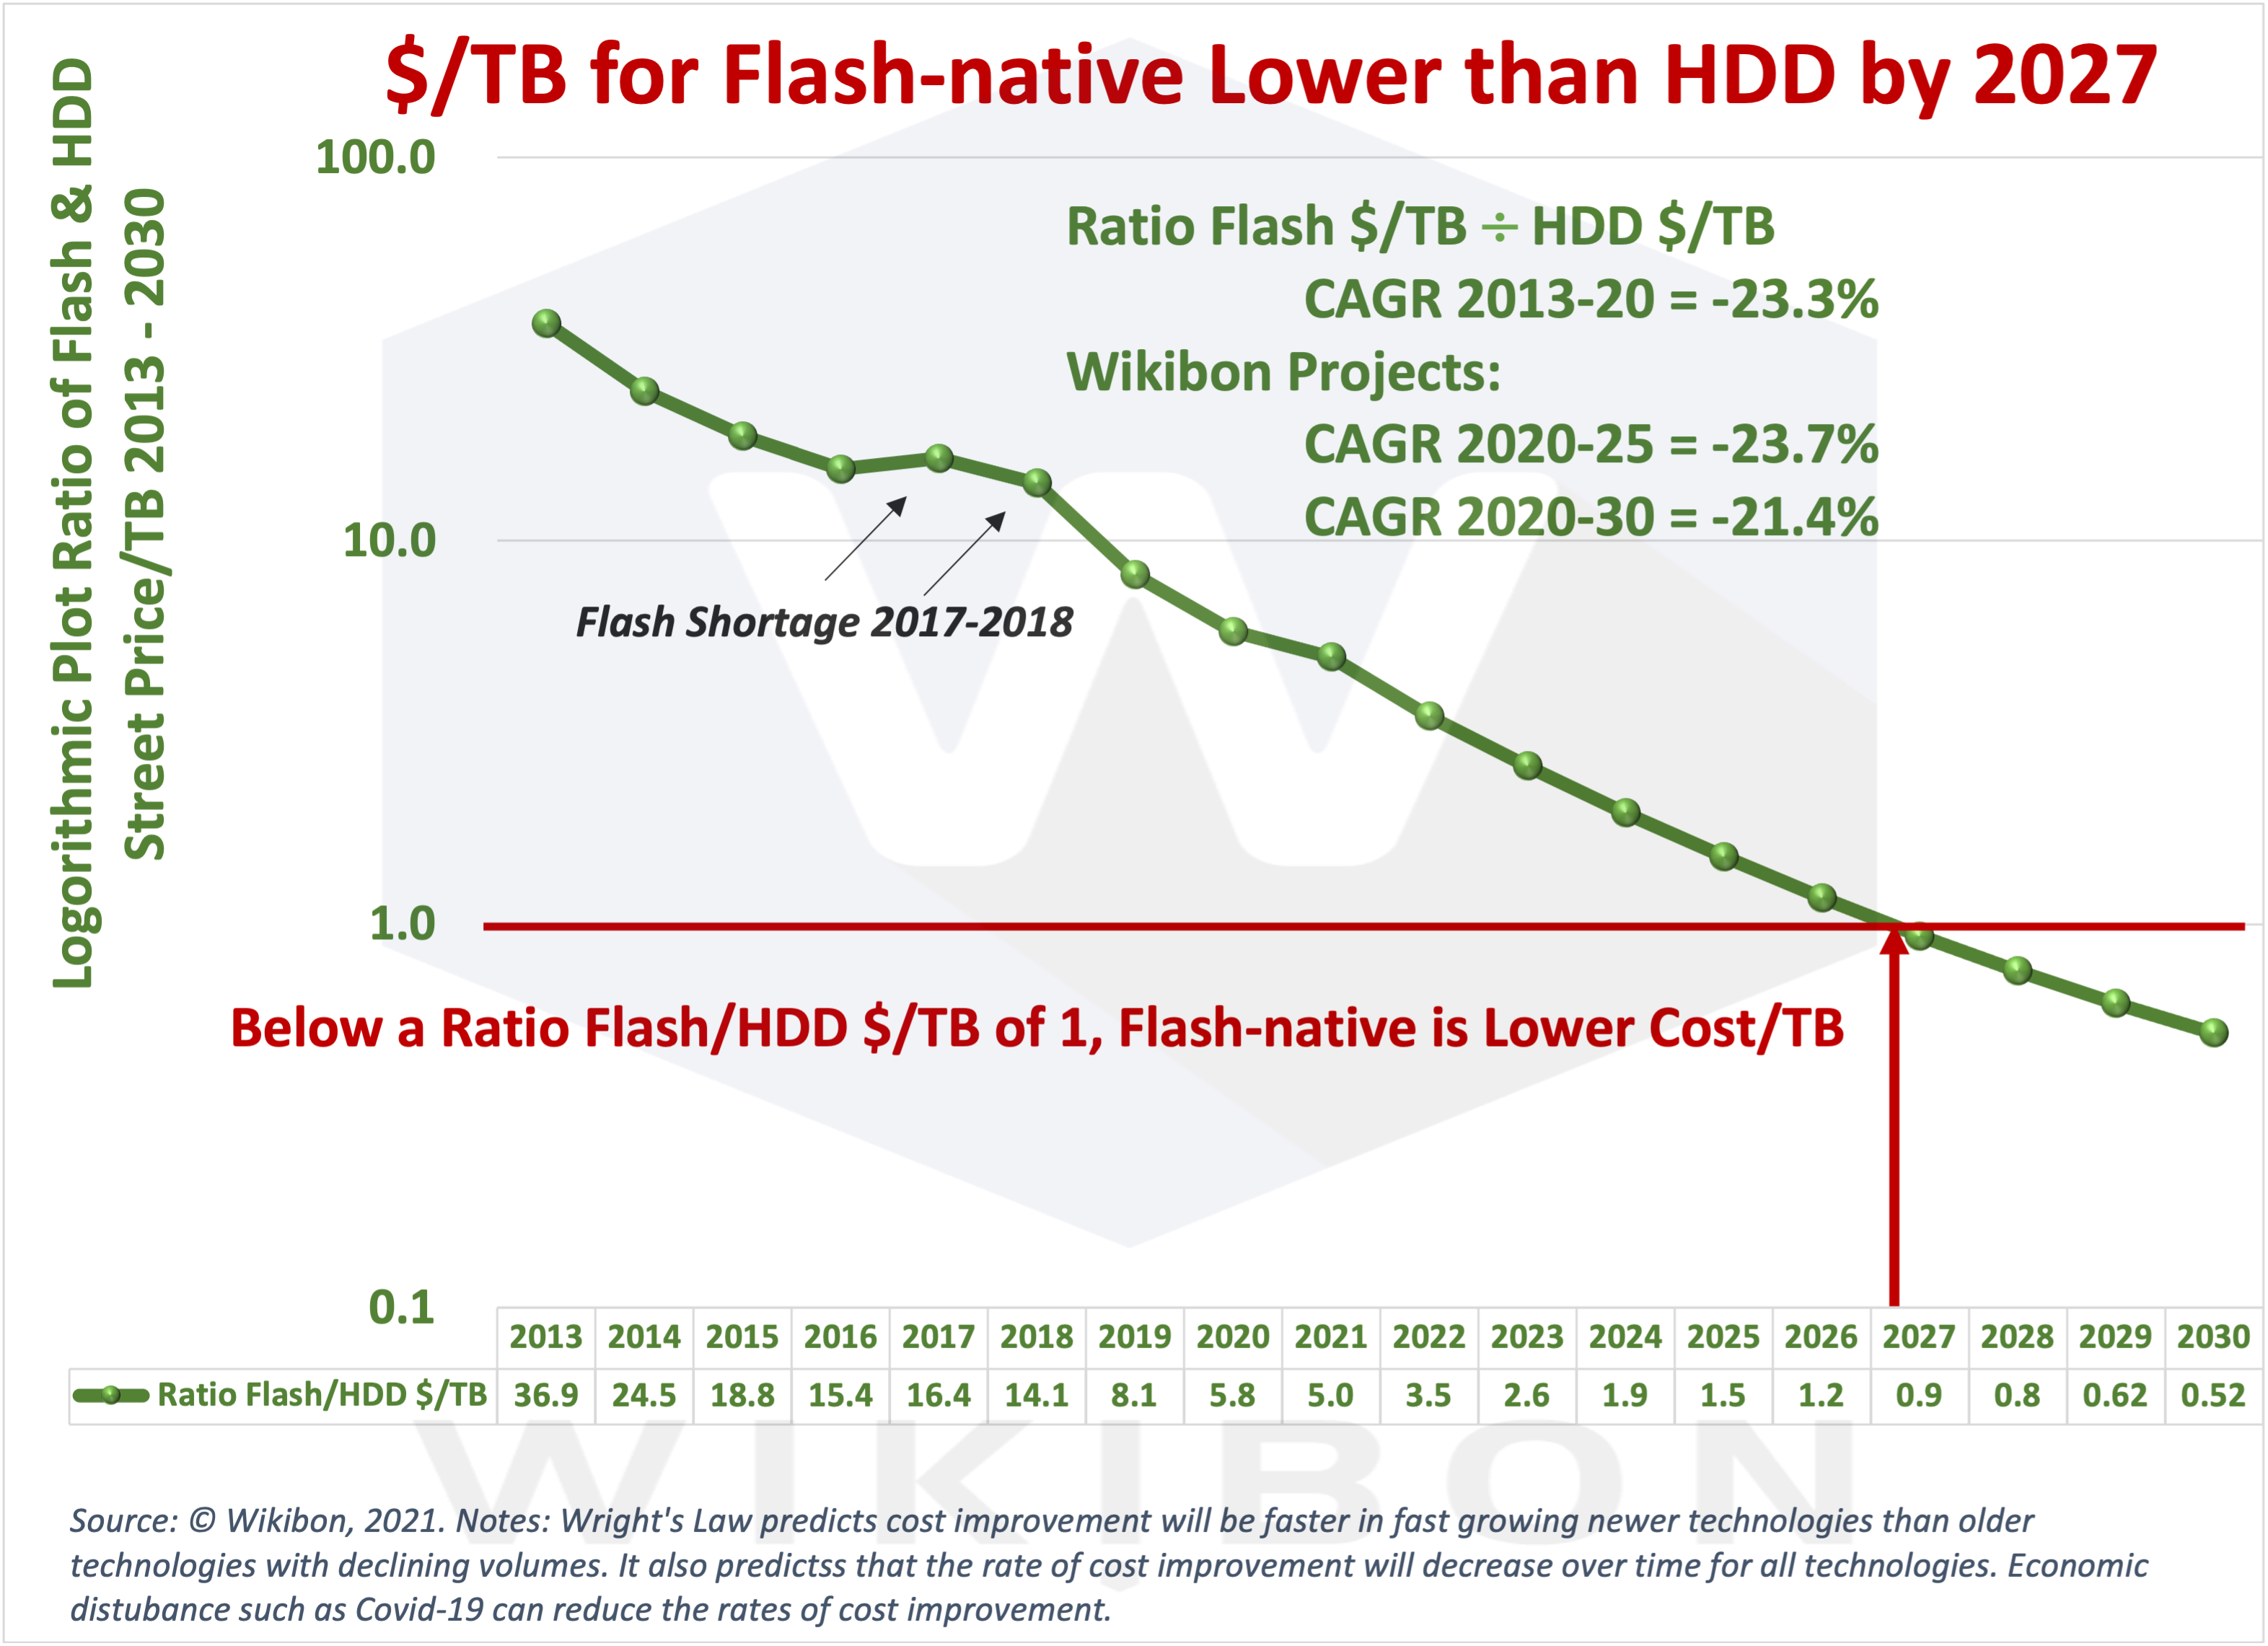
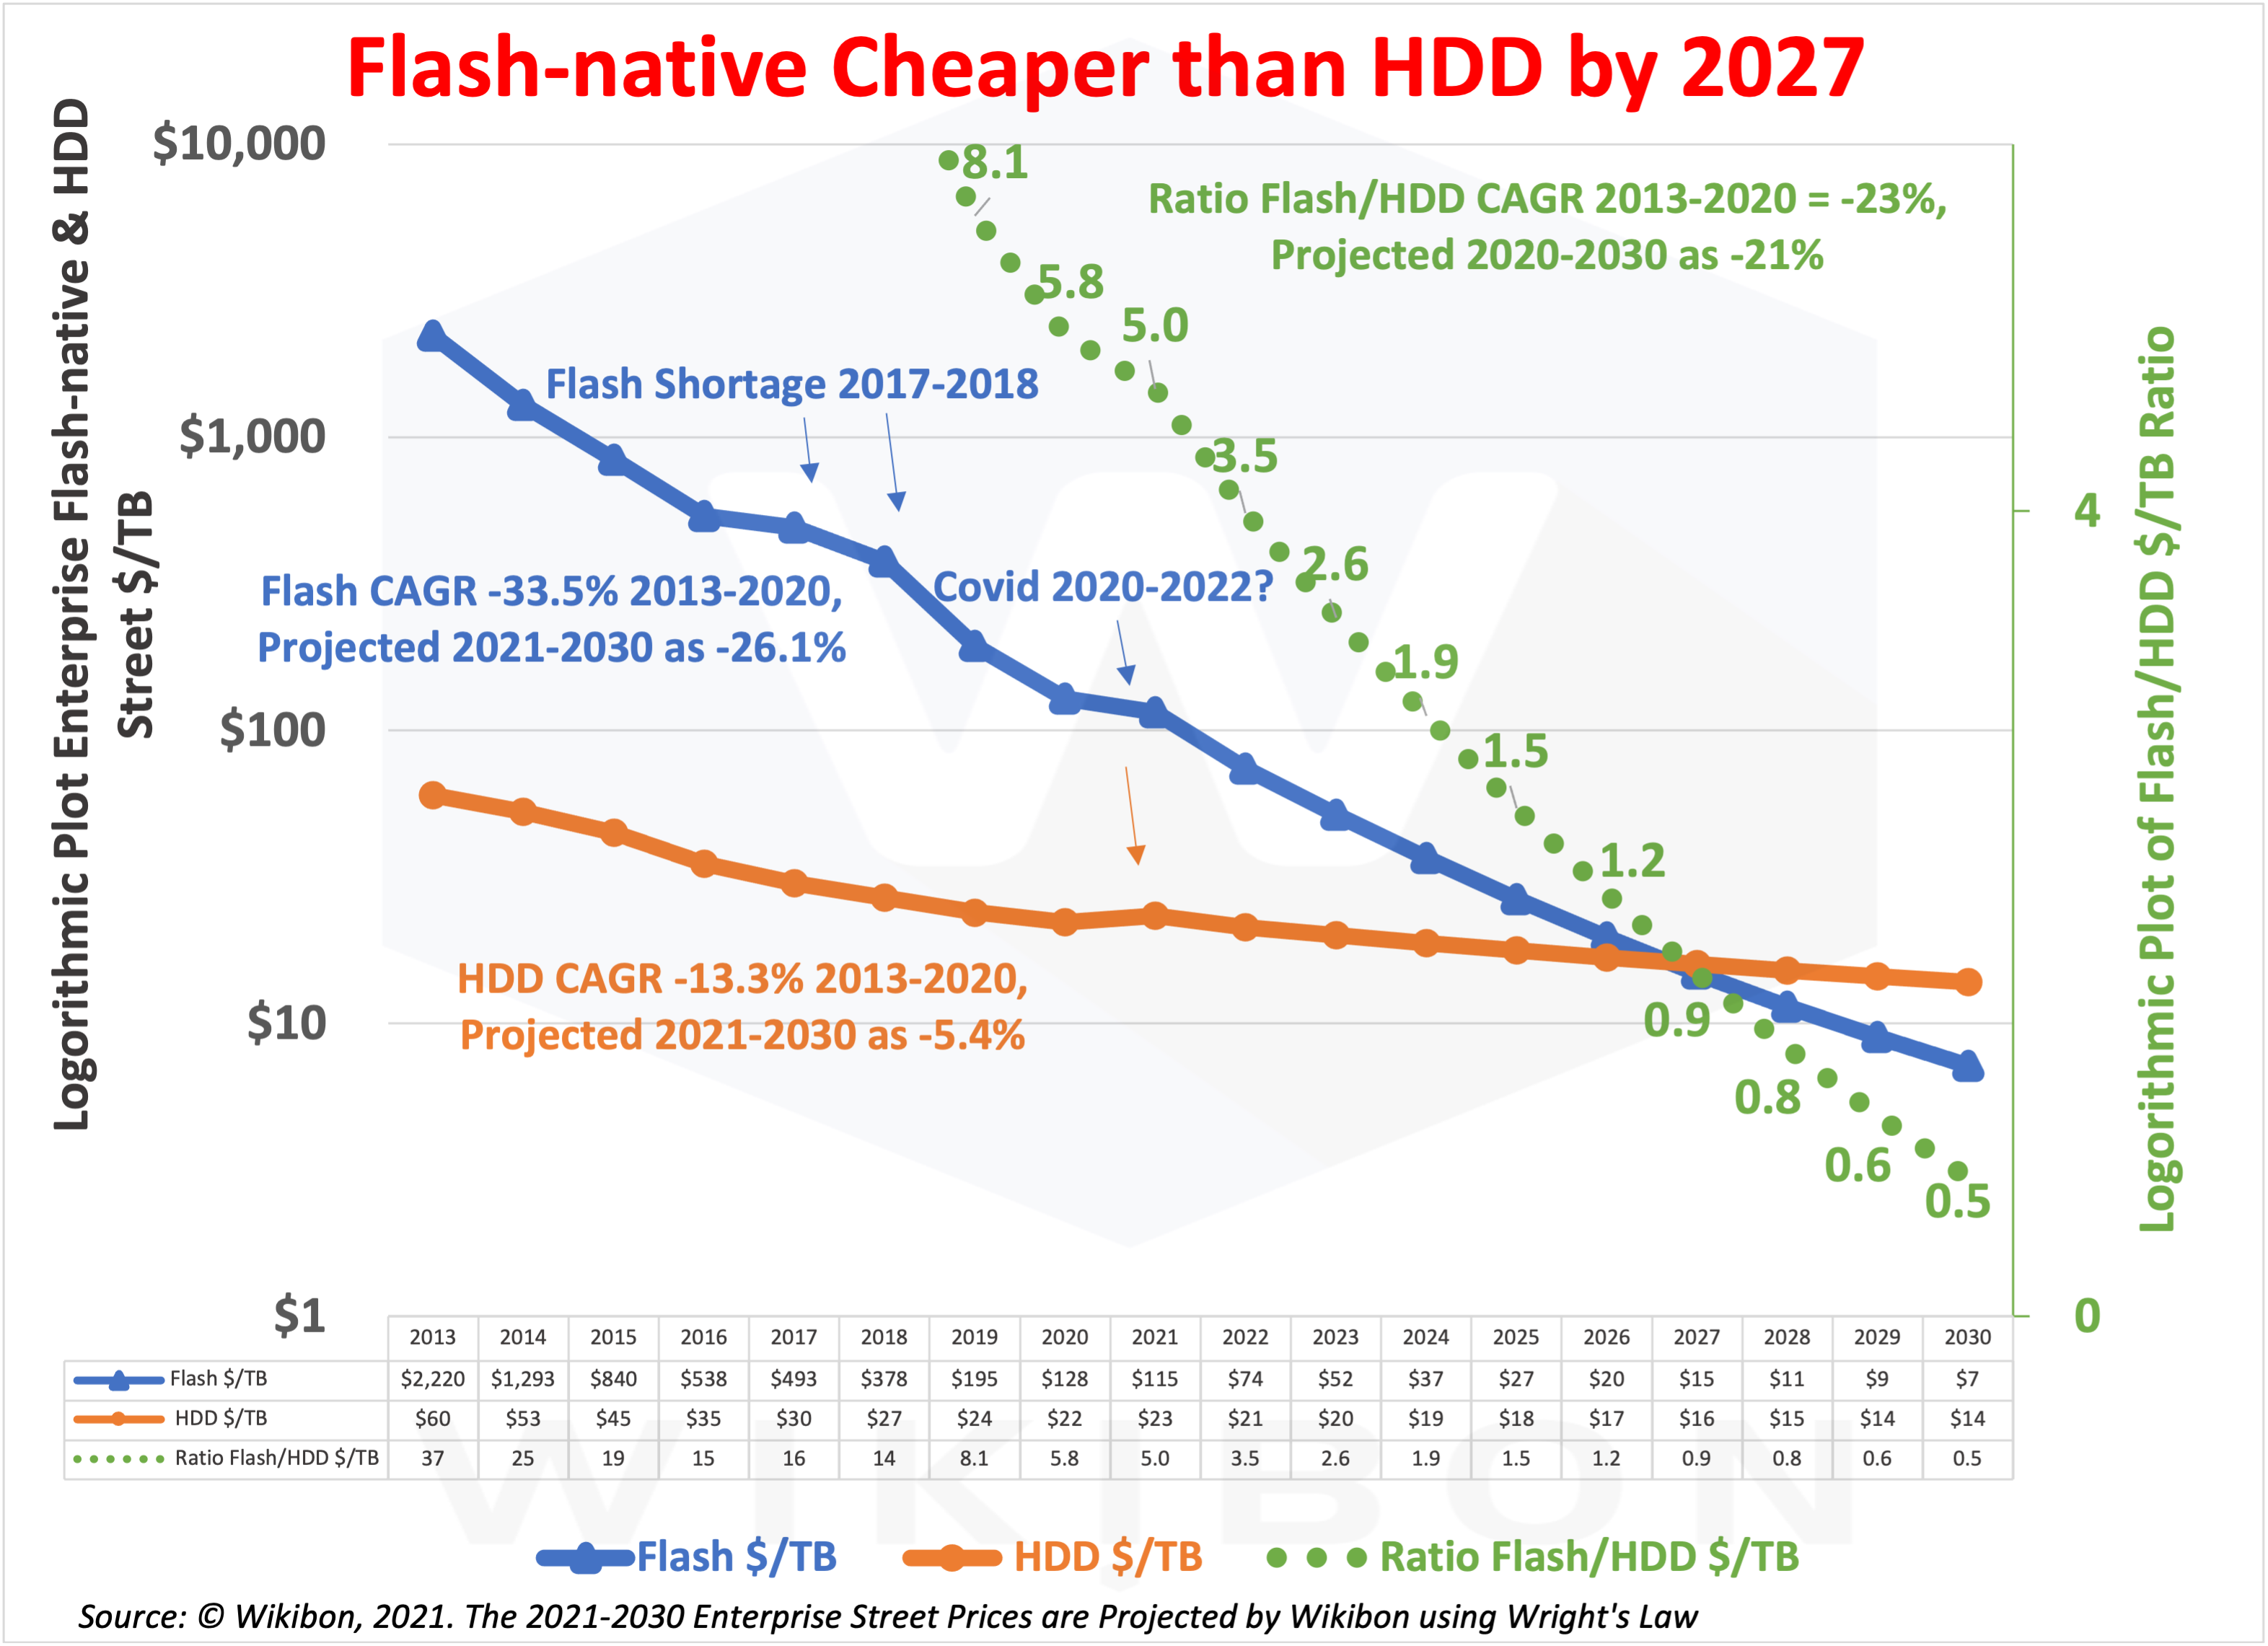
In 2013, the ratio of flash storage price to HDD storage price was over 35 times. In 2019, the flash/HDD ratio was 8x and in 2020 was 6x. Thus, this research will conclude the cost of flash will be lower than HDDs in 2027 and beyond. But, more importantly, this research shows that the real business case for flash is positive for flash storage for almost all valuable enterprise data.
Figure 2 on the left illustrates the road to the all Flash-native enterprise. The bottom x-axis shows the years 2013-2030. The table at the bottom of Figure 2 shows the historical Flash/HDD ratio of street prices/TB from 2013-2020. The left-hand y-axis is a log graph of the table to illustrate the CAGR. The historic CAGR 2013-20 for the ratio is -23%, a six-fold reduction in the ratio over this period.
Figure 2 shows a flash shortage in 2017 and 2018, which dampened the fall in the ratio. However, when flash supply improved in 2019, the ratio was restored to a slightly higher point than expected.
Covid Impact on HDD/Flash-native Forecasts
Figure 1 shows the impact of Covid-19 on HDD shipments. There was a precipitous drop of 34% between 376 million shipped in 2018 and 248 million shipped in 2020, an outlier year. Figure 2 shows Wikibon expects the Flash/HDD ratio to be a little higher than the straight line in 2021.
Wikibon projects that 2021 HDD shipments are about the same as 2020 or possibly a little higher. Prices are raised slightly. HDD vendor revenue and exabytes delivered in 2021 are higher than in 2020.
Some HDD vendors will probably try to frame the 2021/2020 comparison as a heralding of a new HDD revival. Wikibon would point out that 2020 is a Covid-induced outlier, and 2021 probably is a recovery year. The flash vendors have similar positive recovery results. Wikibon’s newegg® consumer street-price Flash/HDD ratio analysis shows the ratio at about 5 in 4Q 2021 as expected.
Economic disturbances such as Covid-19 can reduce the rates of technology cost improvements in general. For example, Covid-19 has affected the supply chains of all IT technology and caused prices of both HDD and flash to increase in 2021 as demand has increased. As a result, Wikibon expects a slight slowing of the underlying trends. Wikibon assesses this will probably push the cross-over time by an additional year. As a result, Wikibon has adjusted its projection of the cross-over date from 2026 to 2027.
Bottom line: Figure 1 and Figure 2 shows the fundamental trends for the last ten years leads to flash storage will become much denser than HDD and will become cheaper than HDD in raw cost/TB by 2027.
The following section will show that the business case for Flash-native storage is already overwhelming for enterprise data with value.
The Cost-benefits of Flash-native
The 10-year IT Business Case for Flash-native vs. HDD
Source: © Wikibon 2021.
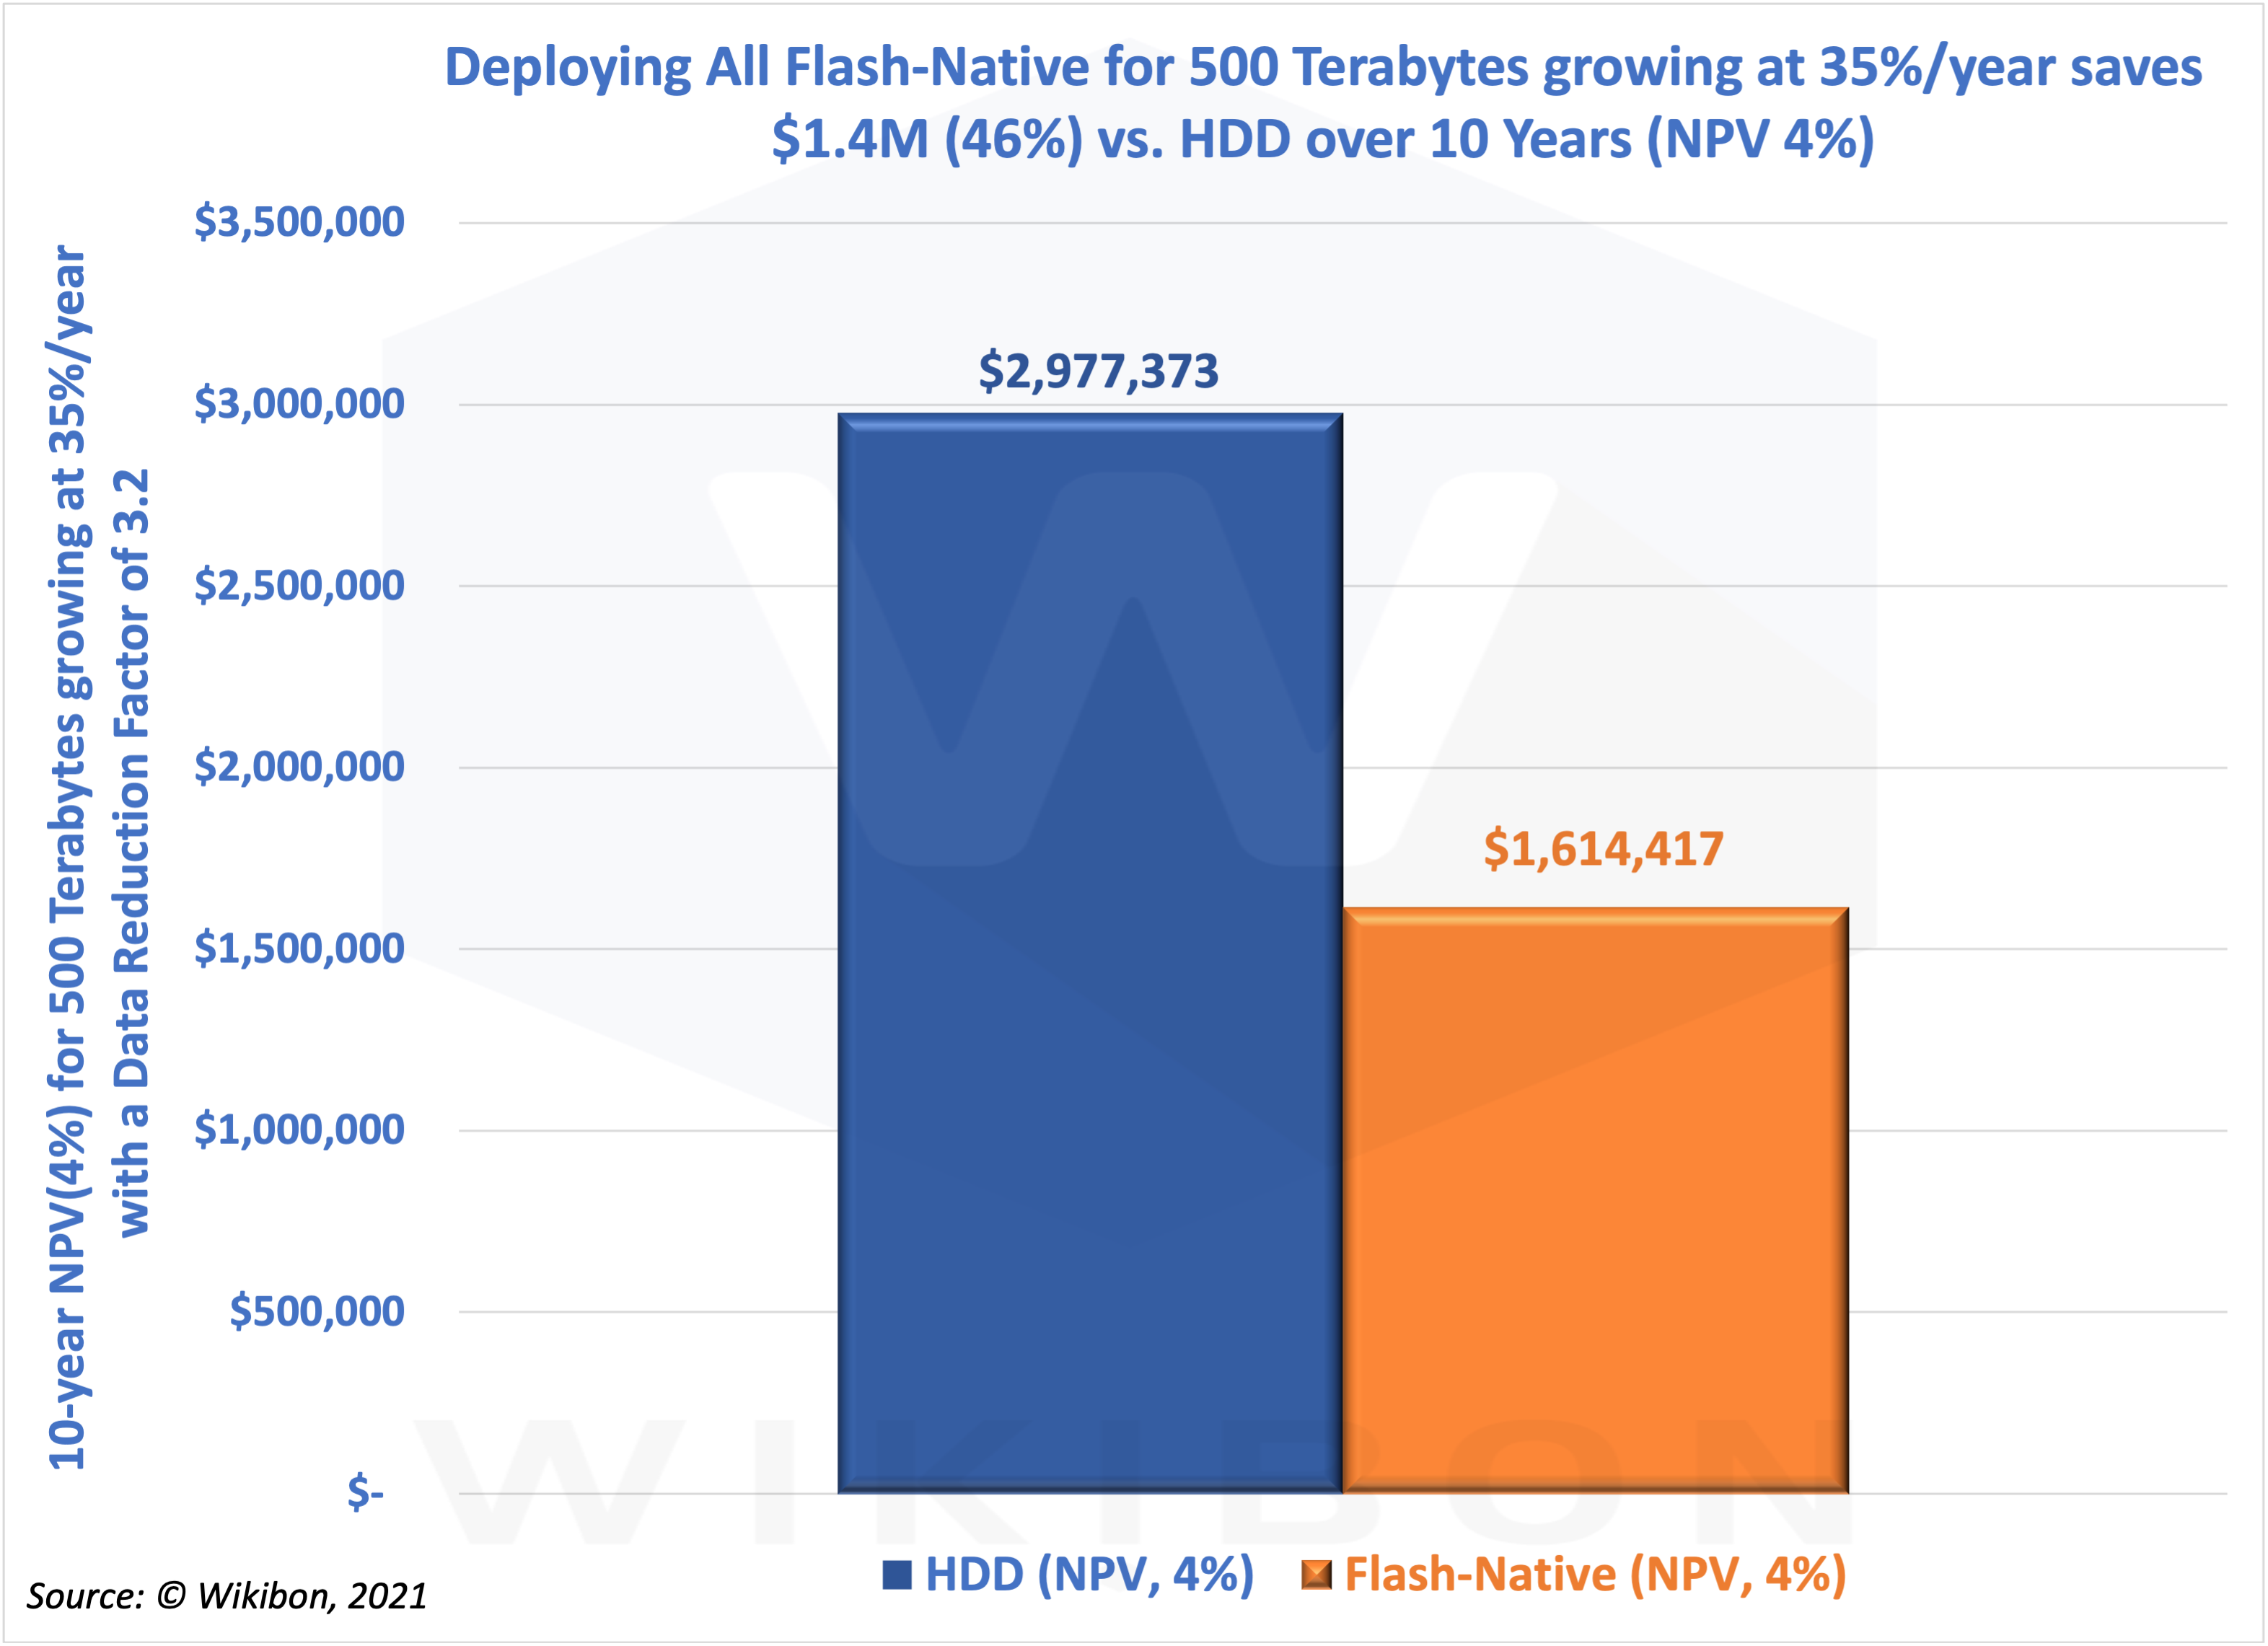
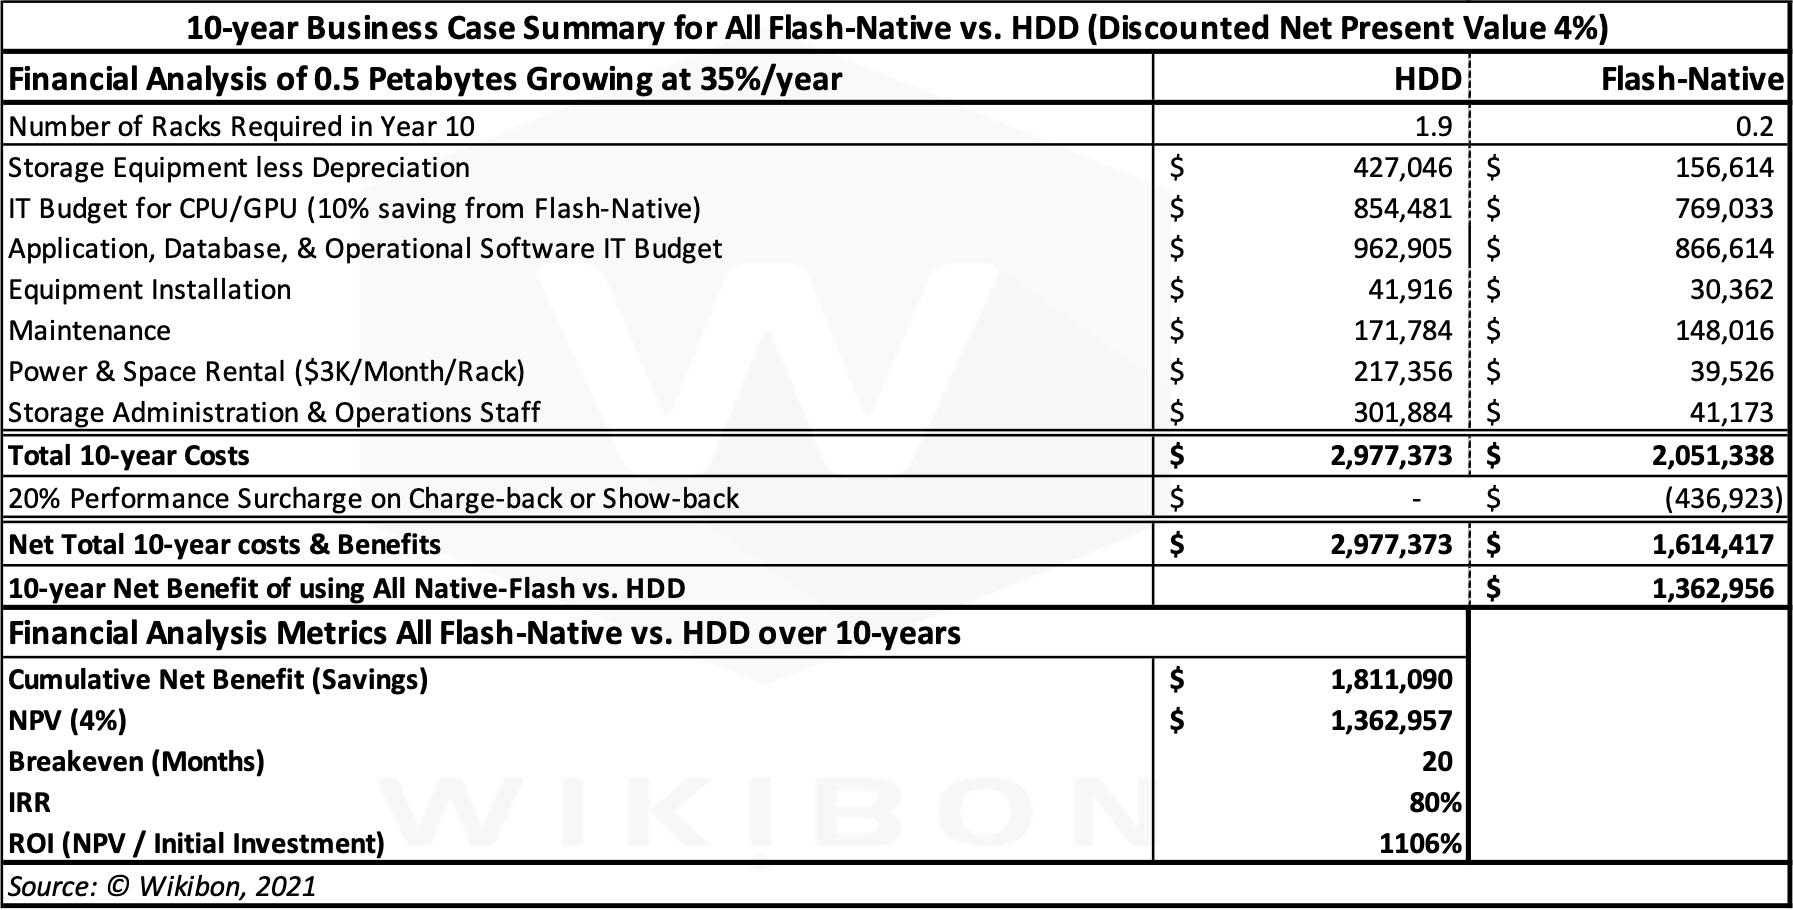
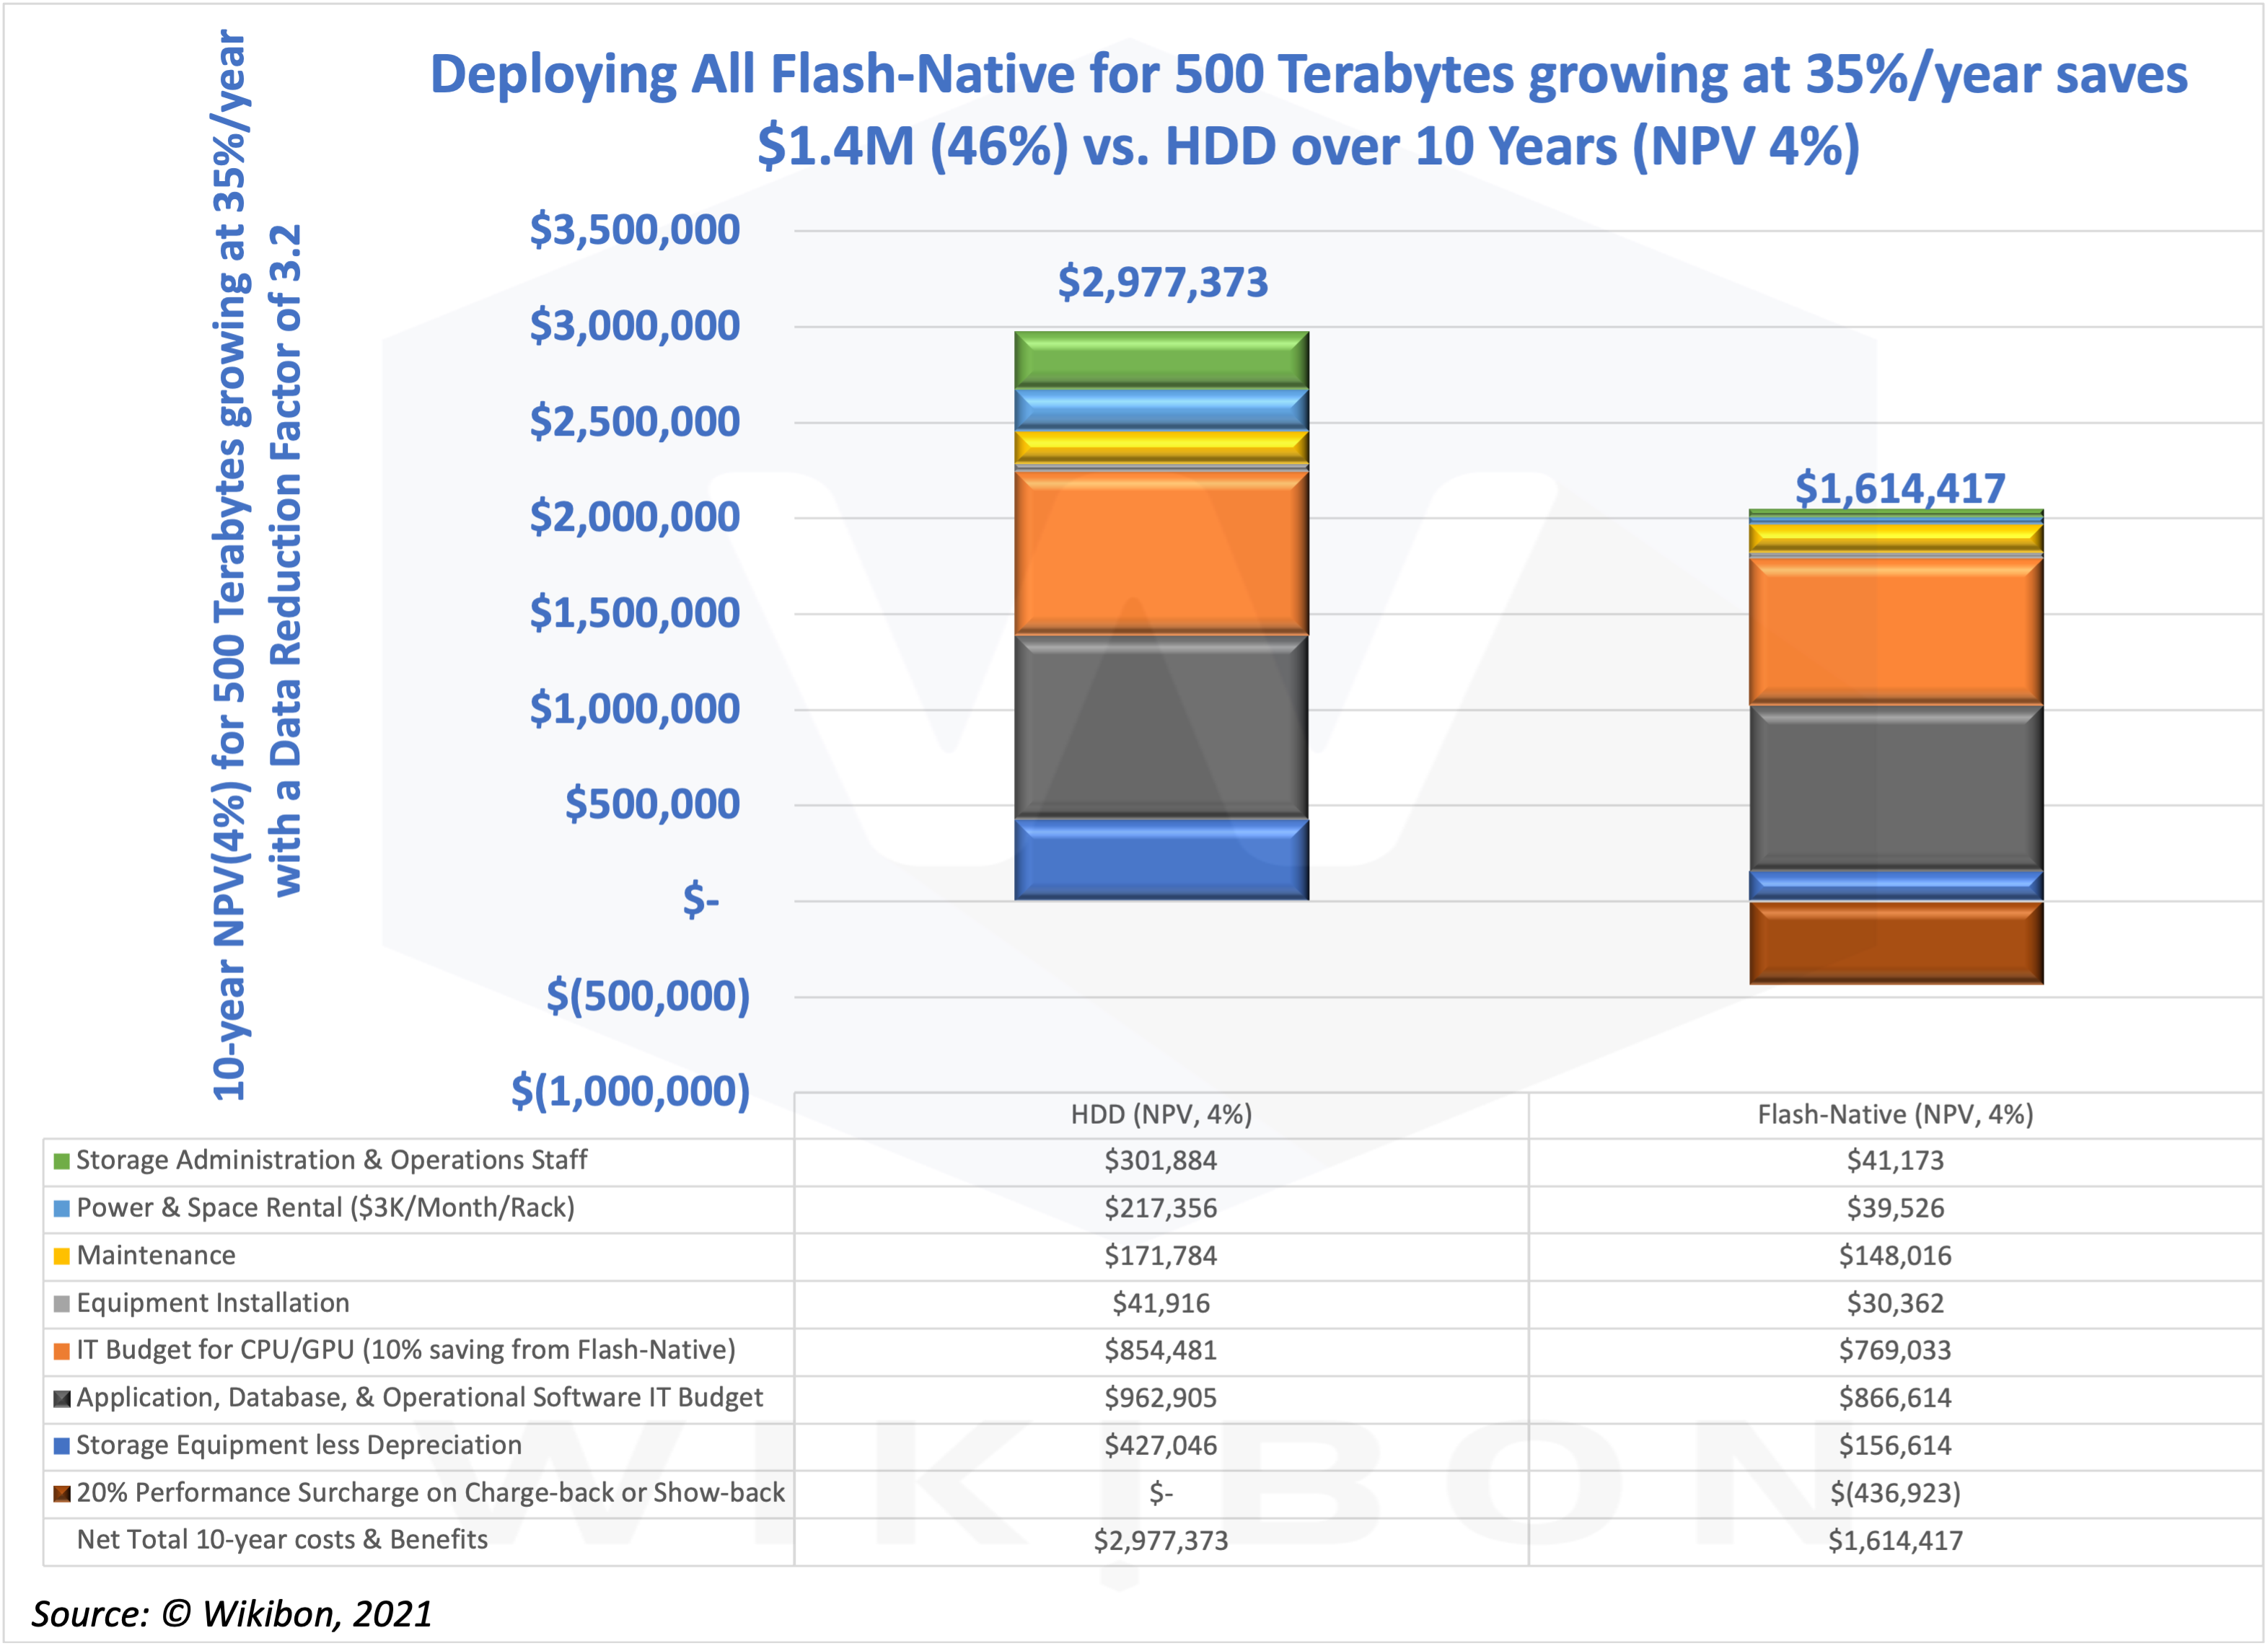
Figure 3 on the left shows an IT department 10-year business case for deploying an all Flash-native solution compared with HDD. The Flash-native reference solution is the FlashBlade file & Object storage system sold by Pure Storage.
The left-hand y-axis is the 10-year Net Present Value (NPV) for 500 terabytes of initial storage growing at 35%/year. The left-hand blue column is the 10-year costs to the IT budget for HDD, with an NPV of $1.3 million. The NPV interest rate is assumed to be 4%. The right-hand orange column shows the IT budget costs of using Flash-native FlashBlade, only $1.6 million.
The IT budget 10-year saving is $1.3 million NPV. The business case in Figure 3 assumes an in-line data-reduction factor of 2 and a reduction factor of 1.6 from the erasure code metadata technology for Flash-native. The overall data reduction factor is 3.2. The most significant savings come from fewer people, less power & space, and lower equipment costs.
The 5-year Line-of-Business Case for Flash-native
Source: © Wikibon 2021
In our premise above, we emphasized that the line-of-business would accrue the primary benefits from Flash-native architectures. These benefits would come from improving the business value the staff could achieve from the improvements in productivity and automation. Flash-native enables the Big Data Mission to combine real-time analytics with real-time transactional processing. In turn, this real-time capability allows much more significant simplification and automation of the business processes supported by the Big Data Mission.
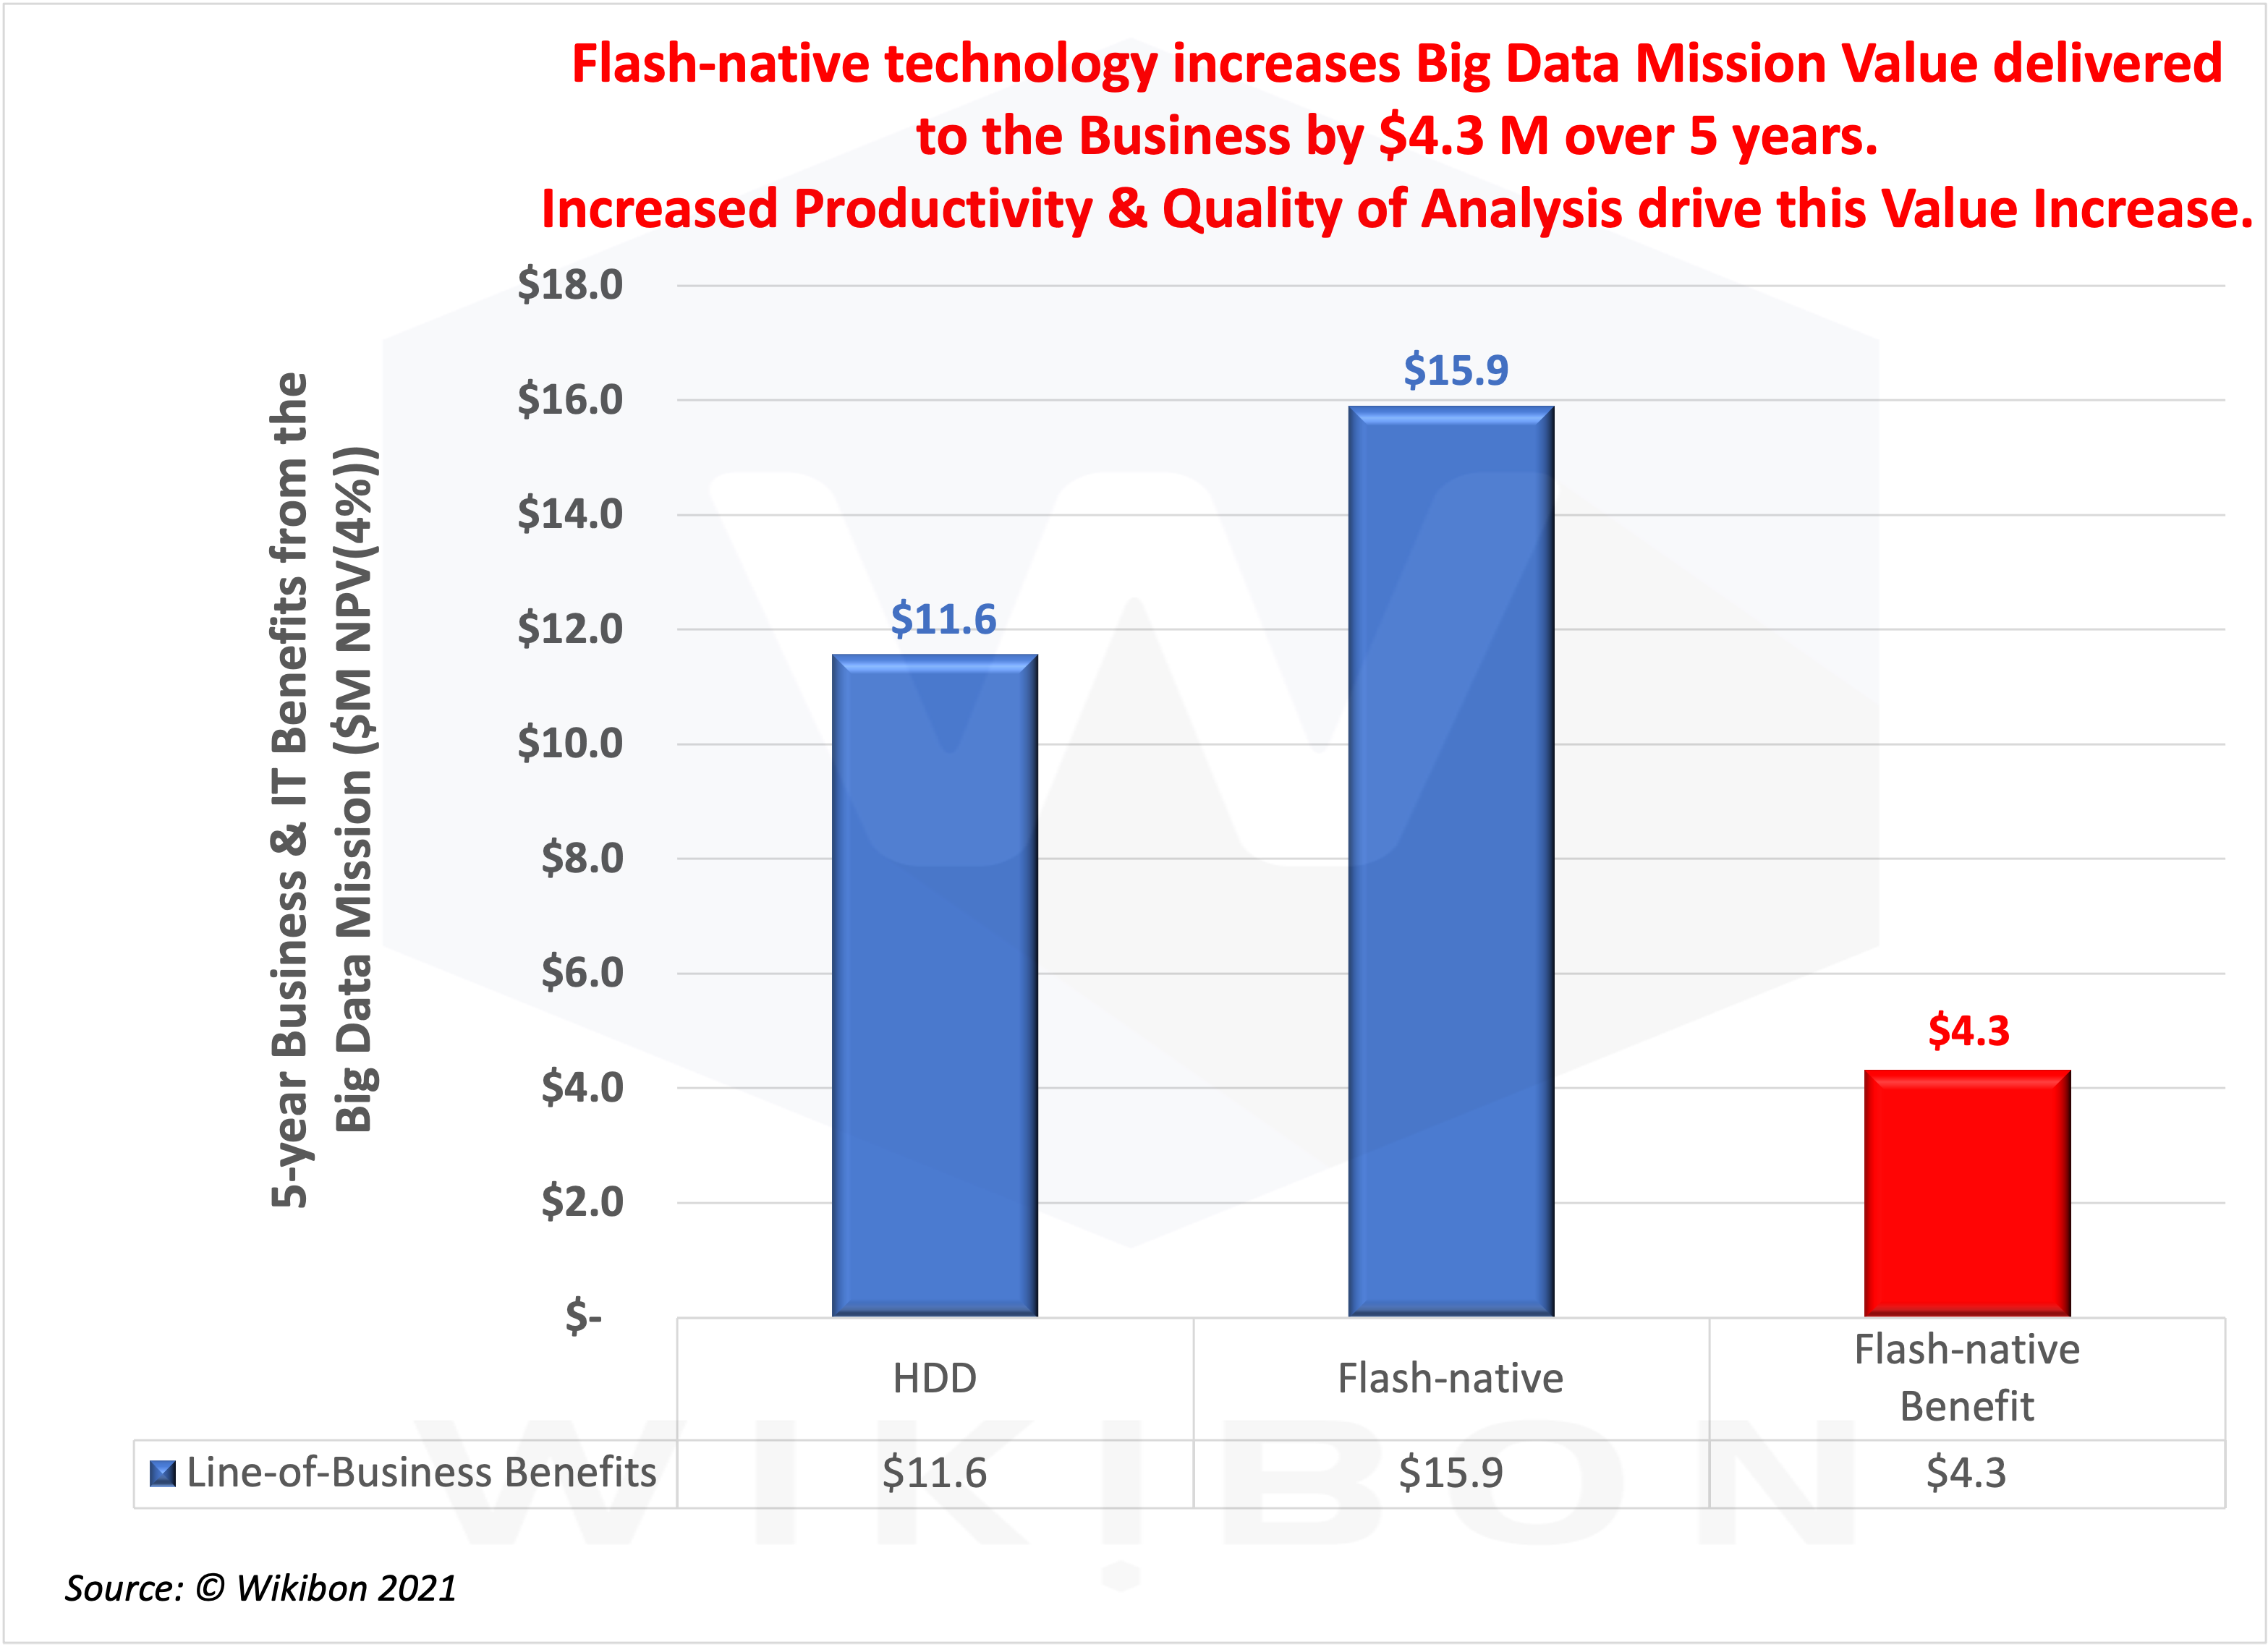
Wikibon’s IT business value approach allows this additional value to be calculated. Table 3 in the “The Business Case for Flash-Native” section below shows the Big Data Mission contributes $3.6 million to the business, assuming that this department is as productive as an average department.
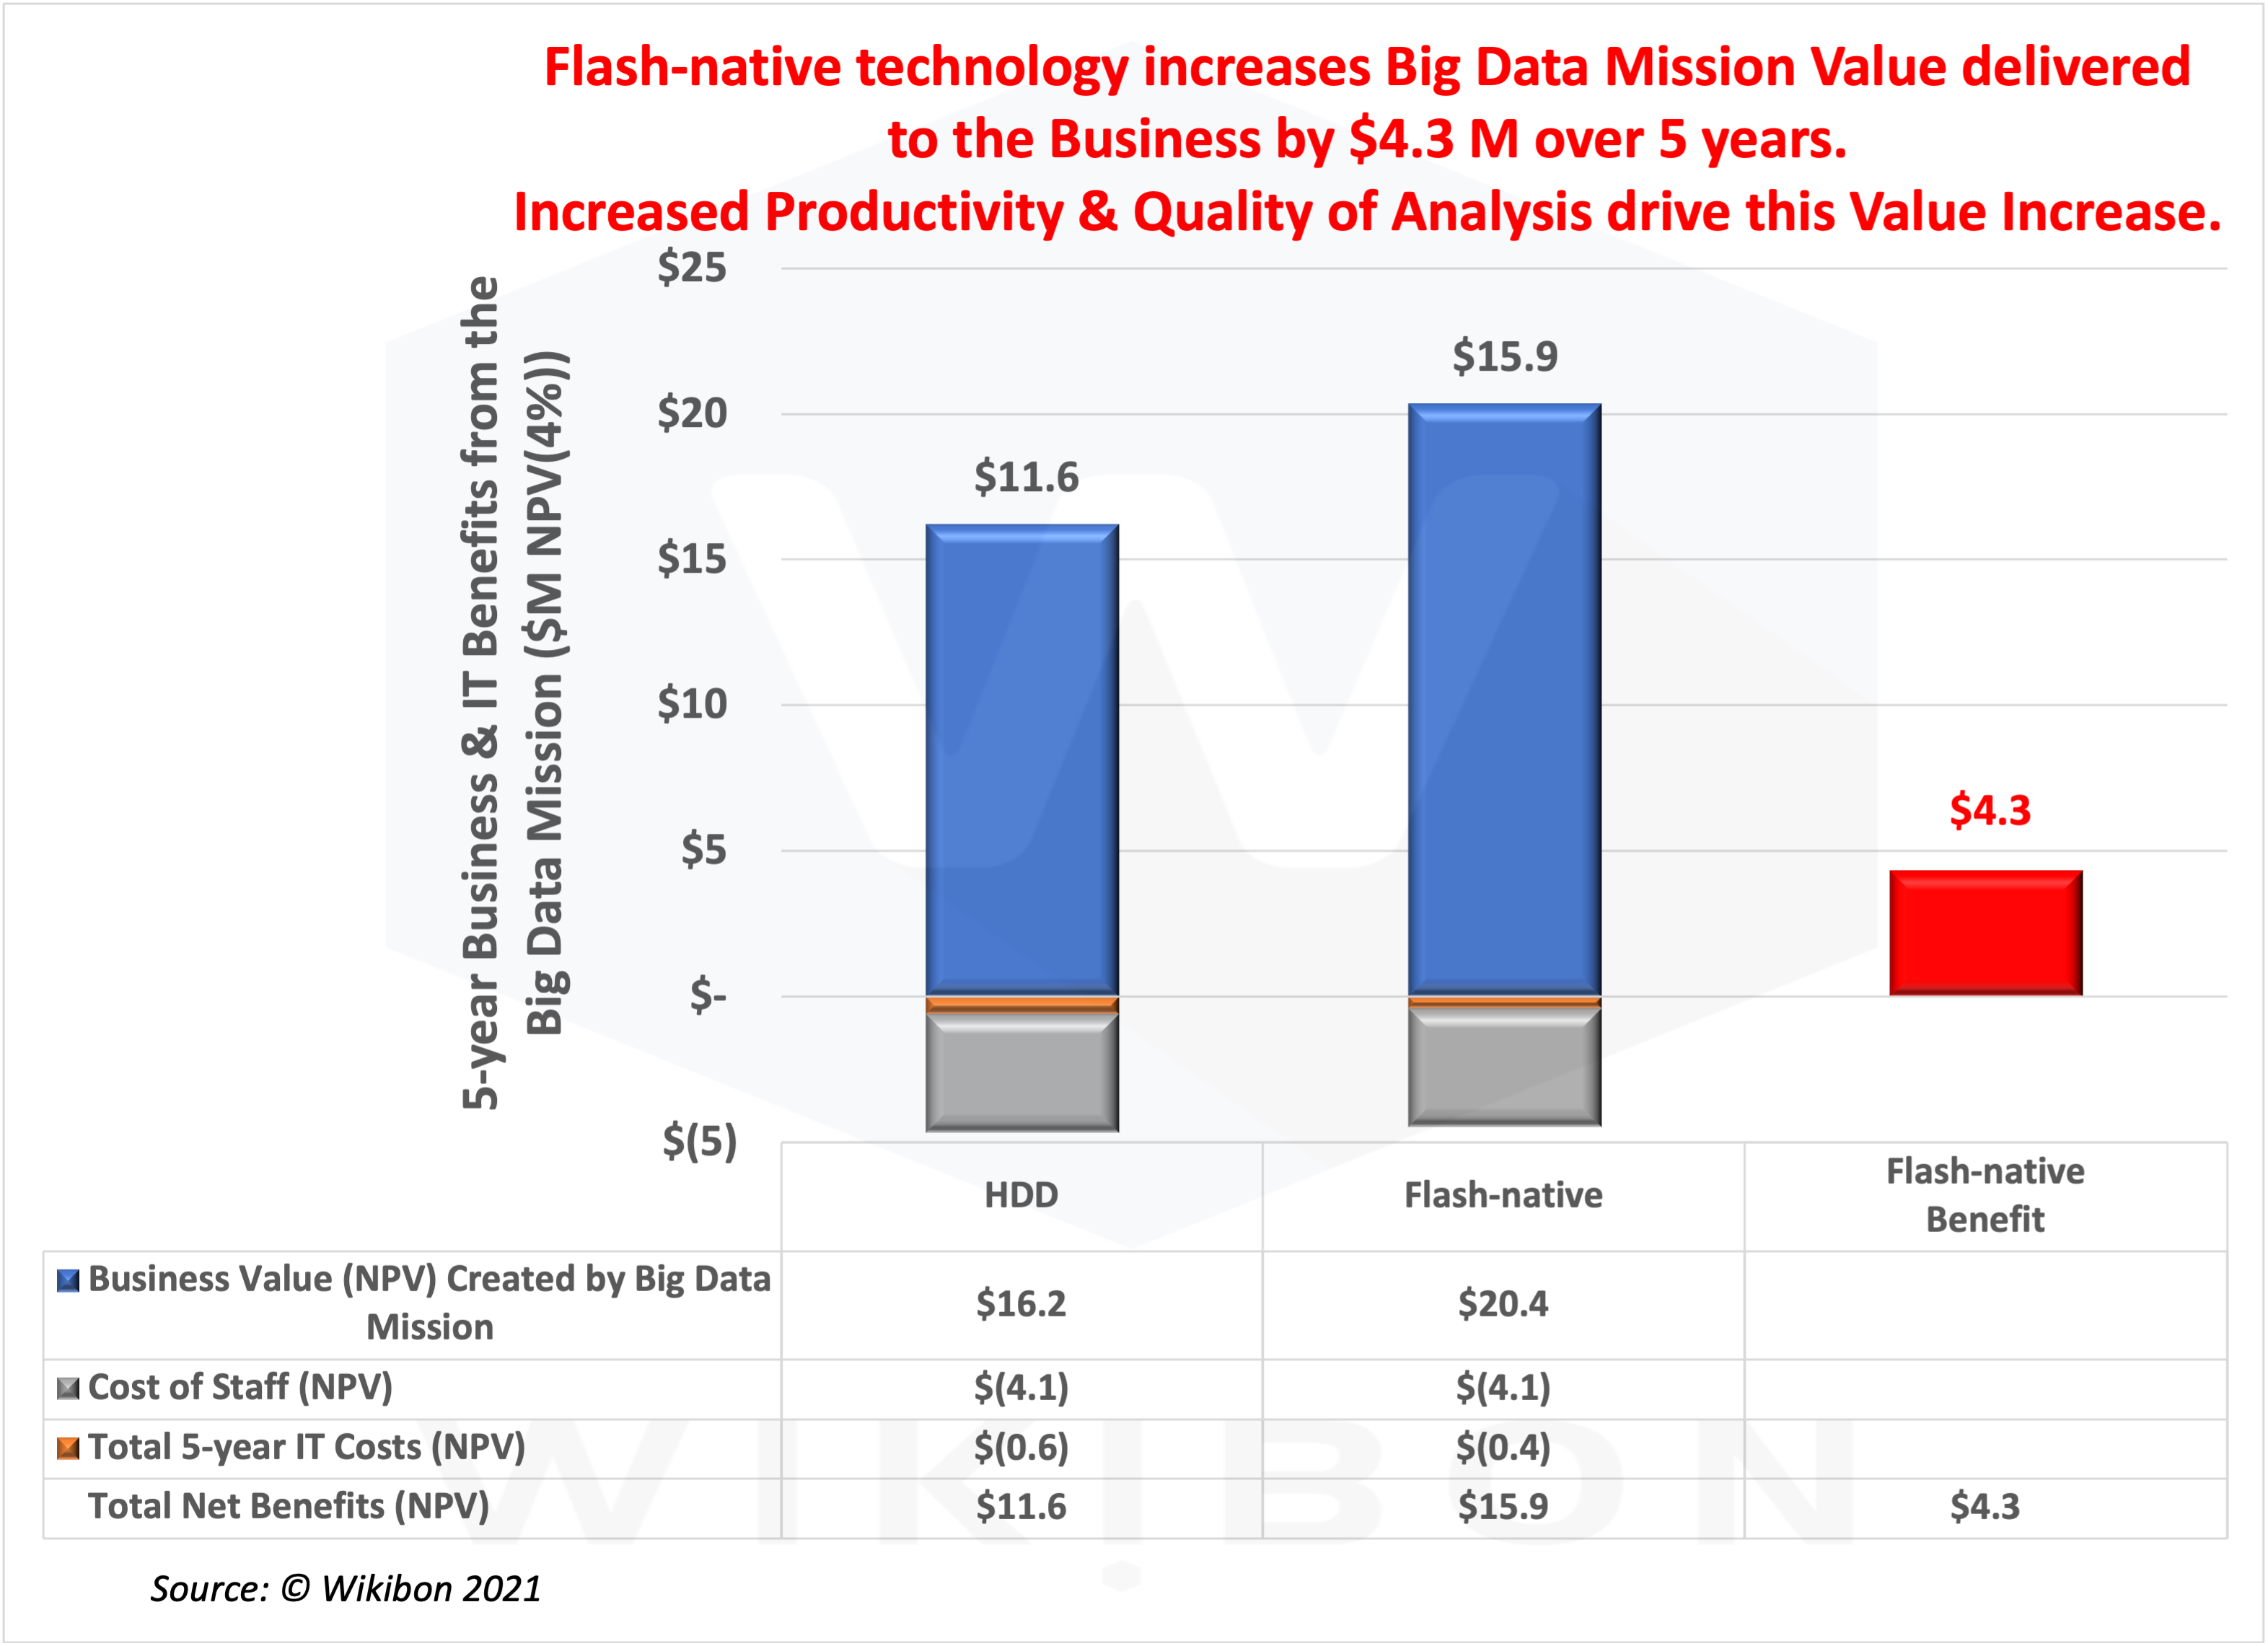
The first blue column in Figure 4 on the left shows the net present value (NPV, 4% discount rate) of the net business value delivered by the Big Data Mission using HDD. The second blue column in Figure 4 shows the net 5-year value delivered using Flash-native storage technology. Finally, the third column in red shows the difference between columns 1 & 2, which is $4.3 million over five years.
The net 5-year figures in Figure 4 are calculated from the business value delivered less the cost of IT support and Big Data Mission staff. Readers can find the details of the calculations in the “The Business Case for Flash-native” section below in Table 5.
Wikibon assumes that using Flash-native storage would enable the same staff in the department to contribute 30% more value. We have assumed a modest start in staff productivity of 5% in month four, and then growing by 2% per month until the 30% improvement is reached.
Wikibon concludes that lines-of-business should immediately initiate Flash-native projects to simplify and automate their business processes and increase their contribution to the business as a whole. Wikibon would also recommend that more staff be employed in the Big Data Mission to reduce the time to roll out automation for asynchronous business processes.
Executive Summary & Conclusions
In summary, consumer volume demand for storage in PCs drove HDD shipments’ original growth from the 1980s to 2010 in the HDD/PC/Intel era. Enterprise storage vendors then adapted the same HDD technology for datacenter and cloud storage.
In today’s Flash-native/Mobile/Arm era, consumer volume demand for flash in mobile devices is now driving flash replacement of HDDs for consumer products such as PCs and mobile. In addition, the continuous Flash-native price erosion is leading most datacenter and cloud HDD farms to replace HDDs with Flash-native alternative architectures.
This research looked in detail at the historical volumes and applied Wright’s Law to project future shipments and prices for HDD and Flash-Native. The study concludes that Flash-Native storage will become cheaper than HDD storage by 2027.
This research also shows the impact of Flash-native architectures on IT costs. It is a solid but minor business case. Wikibon’s clients believe that the real business value of real-time transactions integrated with real-time analytics is to power real-time business processes. The reduction in cost from The impact of business productivity is more consequential and transformative than IT budget savings. Wikibon indicates the value to the lines of business is a factor of 10 higher than the benefits to IT.
The following sections add more details to the methodology and assumptions to the projections and business cases.
Flash-native is the Future
Wright’s Law explained
The formula for Wright’s Law is Y = aXb, where Y = cumulative average cost (or time) per unit, X = cumulative number of units produced, a = time or cost taken to make the first unit, and b = slope of the function. Thus, the law is a power function, and finding a straight line using a logY-LogX graph is a simple way of illustrating the law. Figure 5 is a Log-log graph.
Source: © Wikibon 2021
The left-hand y-axis of Figure 5 above is the log of the cumulative number of HDD shipments. Each line across shows a doubling of HDD shipments. The bottom x-axis is a log plot of time in years. The time taken for each successive doubling is shown on the chart.
Figure 5 shows HDD taking off in the early 1980s. The length of time until shipments are doubled slowly increases between 1984 and 2010, the golden age of the PC/Intel/HDD era. HDD volumes came primarily from PCs. There were several significant improvements to the HDD technology during this time. The last significant HDD introduction was Perpendicular Magnetic Recording or PMR. Seagate started shipping PMR HDD drives in 2013, as well as shingled SMR HDD drives. PMR is the last significant HDD storage technology introduction.
2010 was the peak shipment year for both HDDs and PCs. Consumer spending had shifted to mobile devices such as Apple iPods and iPhones, followed by Google Android mobile software running on Samsung and other chips. Enterprises followed with smartphones and iPads. The straightish line turns into a rapidly flattening curve from 2010. Time and therefore cost reductions went from 30% per year improvement to less than 15%. It took ten years for HDD volumes to double between 2010 and 2020. Wright’s Law says it clearly – volume is everything. Volume drives down product cost, making the product more attractive, increasing volume, innovation, and investment. And almost all technology volume starts with consumer volume.
Price Projection Methodology Using Wright’s Law
Source: © Wikibon 2021
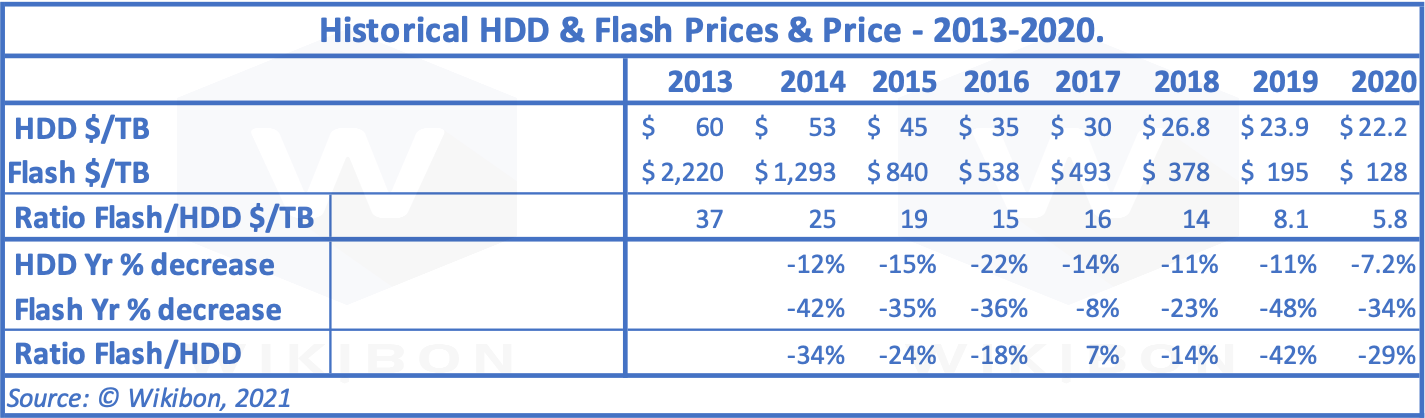
Table 1 shows the street price in $/terabyte for HDD and Flash prices from 2013 to 2020. HDD prices have fallen by a factor of 2.7. The flash prices have dropped by a factor of 17. The key figure in this methodology is the Flash/HDD ratio, which is shown in row three of Table 1. This row shows a steady decline, except in 2017 and 2018, when there was a shortage of flash chips.
If we look at the percentage decline of HDD prices, they are following Wright’s Law. As the volumes drop, the price decline drops. The street price CAGR for HDD is -13%, and -33% for flash.
However, if we project the future with a simple CAGR, we would overestimate the decline. Wright’s Law gives us a better way to forecast Flash $/TB, HDD $/TB, and the Flash/HDD Ratio.
Source: © Wikibon 2021
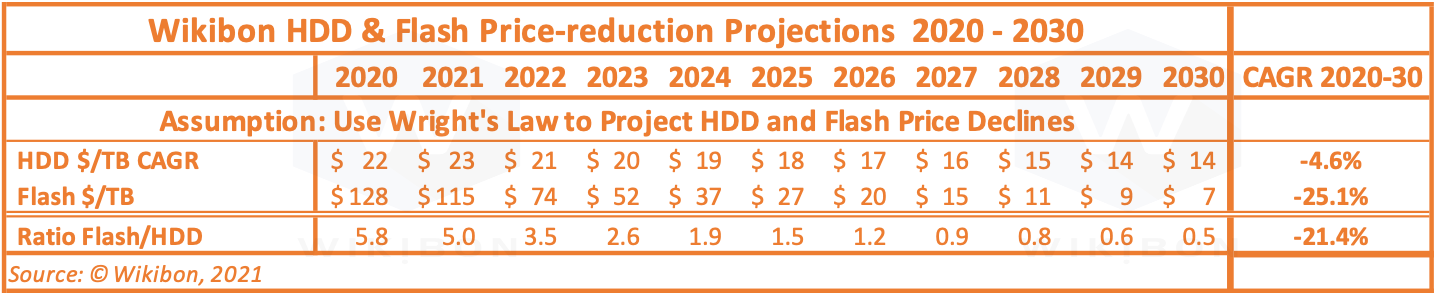
Table 2 shows the Wikibon HDD & Flash forecast using Wright’s Law. 2021 is an interesting year because prices of HDD rise and flash prices only slightly decline. The recovery from the full impact of COVID-19 caused this anomaly. However, the figures from 2022-30 reflect what Wright’s Law would say – HDD prices only drop slowly (CAGR 5%) and Flash 25%. Bottom Line: The projection in Table 3 shows that flash costs less to buy than HDD in 2027. Covid pushes our earlier projection out by one year.
Figure 8 illustrates the projections in Table 1 and Table 2, shows the impact of a flash shortage in 2017-2018, shows the effect of Covid-19 2020-2022(?).
Source: © Wikibon 2021
The HDD Vendor Volume Challenge
Source: ATSC, 2014
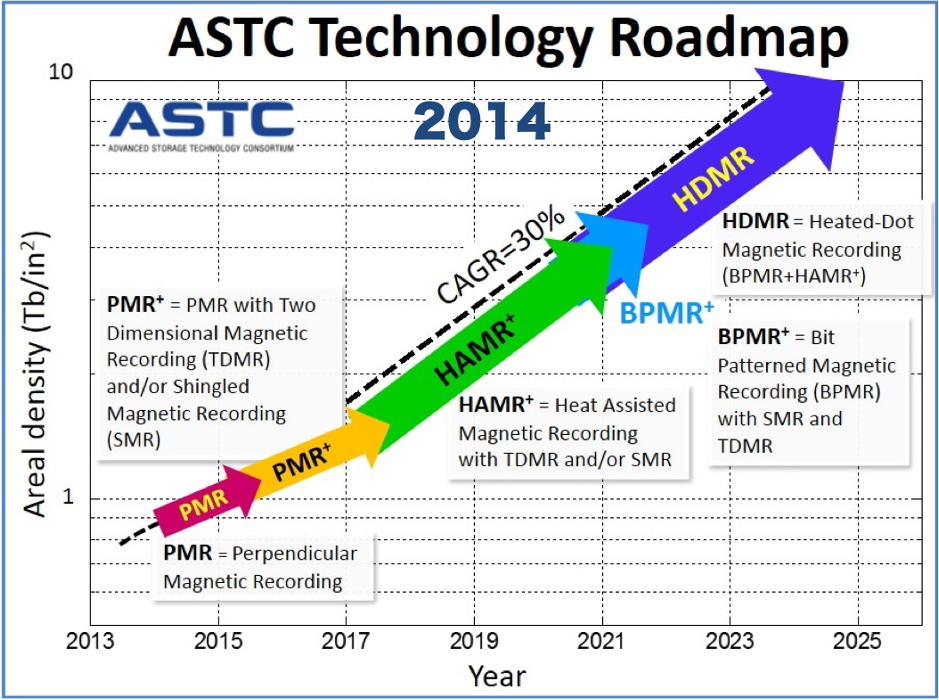
Figure 6 shows the technology roadmap after PMR, as the Advanced Storage Technology Consortium (ASTC) laid out. Wikibon has added the 2014 date to identify the ASTC version. ASTC updated the Technology Roadmap in 2016 and pushed everything to the right by two years. ASTC made the fundamental assumption that the HDD volumes were sufficient for all the areal density CAGR to improve to 30%. This assumption was bold but erroneous. As shown in Figure 5 above, the HDD vendors underestimated the advantages of flash, did not project forward the volume of increases of flash shipments outside of PCs and enterprise flash storage and did not realize the total size of the expanded consumer storage market. As a result, consumer flash volumes came up from below the HDD market and severely impacted HDD volumes.
Figure 6 shows the technology roadmap introducing HAMR technology in 2017 and HDMR technology in 2022. We are nearly in 2022, and neither technology is delivered in volume, nor ever will be. The challenge for HDD vendors is introducing new technologies such as HAMR, MAMR, and the other technologies shown in Figure 6. The new technology must be sold eventually at a lower price point ($/TB) than the existing technology it is replacing. Wright’s Law shows that you need sufficient volume to drive down the learning curve and achieve this price reduction.
Some 16TB HAMR drives are installed in cloud vendors, and recently some 20TB drives. However, the math of Wright’s Law is unforgiving. The HDD vendors have not committed and cannot commit to the volume production of HAMR or MAMR. And the reason is simple. They will lose money, a lot of money, because the volumes are not there to accelerate the learning curve. The historic expanding HDD market disappeared. In a declining HDD market, the volumes no longer exist for technology suppliers of platters, actuator motors, and actuator heads to drive down the learning curves of radical new technologies.
Wright’s Law tells us HDD shipments will never double again this century. Any improvements will come from incremental technology improvements to PMR, business consolidations, and business process improvements. Western Digital, for example, is talking about ePMR improvements – in other words, minor incremental improvements to the existing technology. Wikibon believes that HDD vendors will increase the total capacity of an HDD drive to between 26 and 28 terabytes per drive.
HDD vendors may try and convince enterprises that the 2021 figures mark an HDD renaissance, based on the comparison with 2020. However, Wikibon strongly believes 2021 volumes are a minor market correction caused by COVID-19, and HDD will continue in long-term decline.
The HDD vendors are aware of these facts and are led by intelligent people. However, like mainframes, there is still good money to be made by incremental improvement of PMR technology HDD drives in a declining market. As figure 7 below shows, over a trillion HDD drives will be sold and deployed over the next decade.
Nearline Dominates Future HDD Shipments
Source: © Wikibon 2021
Figure 7 above adds some additional data to Figure 2 in the executive summary. The title of Figure 2 says everything – the “Magnificent Magnetic Hard Disk Drive Technology Era.” An era from 1984 – 2010 where Intel, the PC, Microsoft Windows, and HDDs drove innovation.
Figure 7 shows how rapidly consumer shipments are falling by segment. The consumer HDD volumes dropped by 10% per year between 2010 and 2019. We project volumes will fall by 20% each year from 2019-2025 and fall off a cliff as flash and HDD prices become very close. Consumers now buy over 60% of PCs with flash, and that figure is rapidly increasing. Security video footage storage (within Consumer Electronics) is the only consumer area where HDD is growing.
Datacenter storage benefited from consumer volumes and has increased in importance to HDD vendors. In 2020 the percentage of datacenter drives was 27%, and Wikibon expects it to be 90% by 2030. However, datacenter HDD shipments only grew by 3.5% from 2010-2019 (consumer HDD dropped by -9.4% over the same period). The section on Wright’s Law above explains why this growth rate is insufficient to fund significant new technology innovation.
Figure 7 also shows that Nearline HDD drives will dominate production during this decade and provide most of the HDD capacity for Cloud Providers and large-scale enterprises. Nearline drives offer the lowest cost $/terabyte and are projected to grow shipments until 2025, as the rest of the market falls away. The HDD workloads will increasingly write WORN data (Written Once Read Never) of low business value. The benefits of larger HDDs are real, but only if the price is right and the data can be retrieved. Flash-native storage already delivers over five times the HDD density and 10-1,000 times HDD performance.
Flash Exabytes Already Exceed HDD Exabytes Shipped
Flash Technology Enhancements
A production revolution in NAND flash came when 3D flash chips were introduced and “grown” vertically. This technology dramatically increases the potential storage capacity of chips. NAND vendors are confident they can increase the number of layers to many hundreds.
Adding additional bits per cell is another technology that increases the capacity of NAND chips. For example, the NAND 3D chips started with just one bit per cell in SLC flash. These cells now have 4-bits per cell, called QLC flash. In addition, PLC flash with 5 bits per cell is on its way. As a result of the consumer demand for flash storage and the investment in new flash technologies, flash volumes are doubling fast, and flash prices are coming down at over 25% per year.
Storage Exabytes Shipped
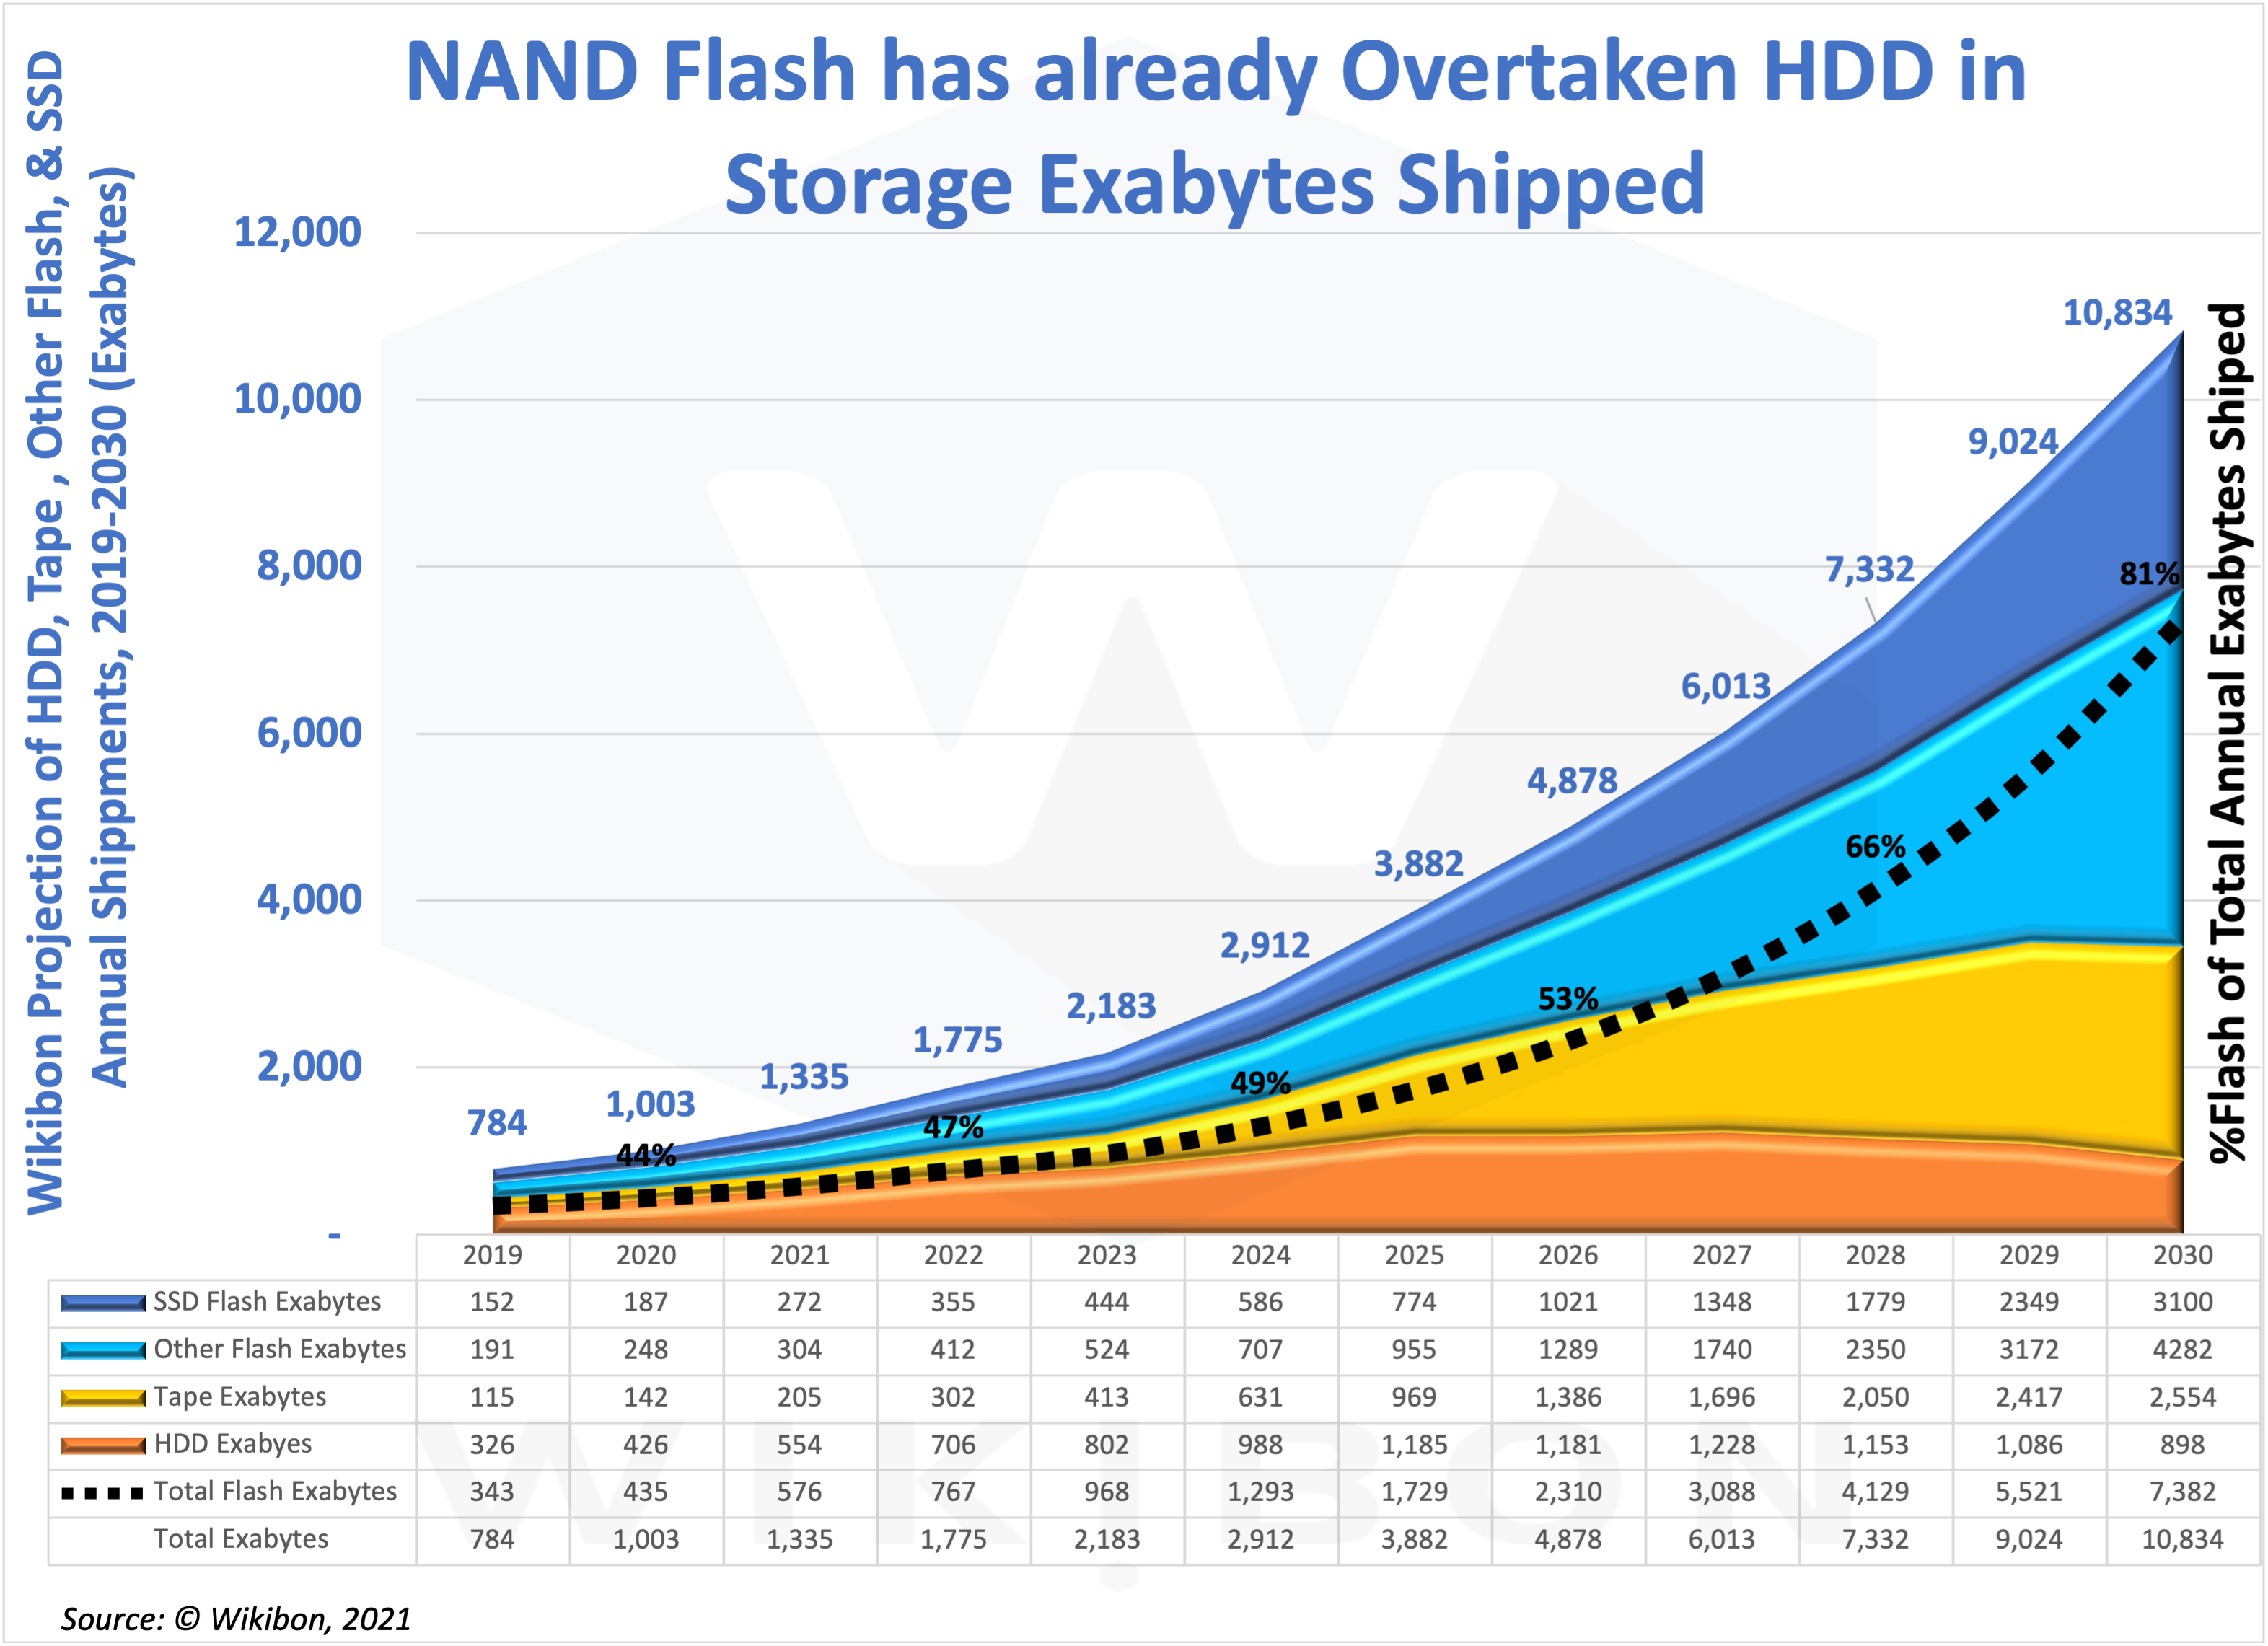
One common myth promulgated by storage vendors is that HDDs store the vast majority of data. Further, they point out that the capital cost of NAND flash boundaries is high compared with the low cost of HDD assembly plants in Thailand and other countries. Figure 8 addresses this myth.
Source: © Wikibon 2021
Figure 8 above shows the growth in exabytes shipped by storage technology. There are two flash categories, SSDs (the dark blue segment in Figure 8) and “other” flash form-factors (the light blue part). “Other” flash form-factors include consumer flash drives for PCs, flashcards for cameras, and many other Flash-native solutions. The common component for both types of flash storage is NAND flash chips. Wikibon projects that about 60% of total flash exabytes are the “other” Flash-native segment by the decade’s end. Overall, we expect flash exabytes to grow at about 32% per year.
The orange section of Figure 8 shows the HDD exabytes shipped in 2019 were 42% of the total storage shipments. Wikibon expects the HDD exabytes to grow at 24% per year until 2025 and then decline slowly until the decade’s end. Thus, HDDs will be a significant storage media for the next four years.
The yellow section of Figure 8 shows the significant growth in tape exabytes shipped. Tape is an order of magnitude cheaper than disk or flash in $/TB stored. As flash takes over the processing of active and valuable data, Wikibon expects HDDs to give way to Flash/tape hybrid libraries to store WORN data (Written Once, Read Never). As a result, Wikibon expects tape exabytes to grow at a similar rate to flash (33% per year), especially towards the decade’s end.
Total Flash Exabytes Shipped & Wright’s Law
The critical common and most expensive component of both flash storage types in Figure 8 is NAND flash. The primary cost reductions from Wright’s Law will apply to NAND flash production. The correct way to assess flash volume is to add both types of flash storage. The total storage volume of flash already equals that of HDDs. If you look at the table under Figure 8, you will see that the Total Flash Exabyte line (the sum of SSD flash and “other” flash) just exceeds the HDD exabytes delivered in 2019, growing to twice as high in 2026 and over eight times the HDD capacity by 2030.
The total flash data is shown on the right-hand y-axis of Figure 8 as a percentage of total storage and is shown as a black dotted line in the chart. This line grows from 44% of all storage in 2020 to an expected 80% by 2030. Magnetic storage will probably revert to tape, as tape is an order of magnitude cheaper than HDD, is faster to read and write, and is much denser than HDD. In addition, tape libraries can automate manual work. For the WORN data discussed above, magnetic tape with flash-based metadata as a front-end is the cheapest solution projected in Figure 8 to replace HDD.
Bottom line – some vendor observers have said that the investment required to make sufficient flash to replace HDD would require too much capital equipment, and manufacturing HDDs requires less capital. However, flash manufacturers such as Micron are already making the same storage capacity as HDDs. Micron alone has announced a $150 Billion 10 year investment program for memory fabs and R&D. New NAND fabs are already installed in China. New flash capabilities are creating new opportunities for storage.
Micron and other NAND flash producers are not investing for fun. Instead, these companies are including investment costs in their flash pricing. As a result, the capital for NAND flash production was available to equal HDD exabytes delivered, and future investment is available to meet market demand for Flash-native storage.
Myth busted.
Flash-native vs. SSD
The 3.5″ and 2″ are the sizes for HDD drives. SSDs were initially introduced by EMC in 2008 and originally used the same form-factors and protocols. Flash vendors utilized as much as possible of the HDD ecosystem to minimize the cost introduction costs and minimize friction in SSD adoption. New protocols such as NVMe have improved the speed and overhead of storage protocols. NVMe-oF (NVMe over Fabric) has improved any-to-any connection of servers and storage and has allowed ethernet to evolve as the industry standard for storage networking.
However, new technologies eventually have to discard the early baggage. The form-factors for flash are already much more numerous than HDD. Flash-native designs use the raw NAND flash chips but allow completely novel designs beyond that.
Pure Storage is a major fast-growing storage vendor that utilizes Flash-native architectures. The Pure FlashBlade architecture is far more efficient than SSD architectures in managing the local and remote copies of data, optimizing data placement, and managing multiple levels of NAND technology. The business cases in this research use the Pure FlashBlade as the reference technology.
Arm and TCSM have separated design and production as independent businesses. This separation has introduced the ability of enterprise companies to develop their chip technologies, as AWS has done with Nitro, Graviton 1, and Graviton 2. Alibaba, Microsoft Azure, and Oracle have followed suit. Companies such as Tesla and Nvidia are designing their own compute hardware within a two-year cycle time. Wikibon believes that cloud vendors, Pure Storage, and other companies will develop integrated Flash-native storage solutions with higher functionality and improved cost.
Alternatives to Flash?
Significant investments are being made in alternative technologies to NAND Flash. The three main digital storage types are SRAM, DRAM, and NAND, and they have been around for a long time and survived many attempts to displace them. Intel and Micron produced a Phase-Change Memory (PCM) persistent storage technology called Optane. However, the solution was tied to Intel processors. Some storage vendors are using this, but the volume of demand for Optane is tepid. A report based on Intel’s SEC filings concluded that in the first three quarters of 2020 every dollar of Optane revenue cost Intel $1.59. There is no demand for Optane in consumer products, which dooms volume. As a result, Micron is selling its Optane manufacturing capabilities and is focusing on SRAM, DRAM, and NAND.
The Arm v9 architecture has greater potential for supporting alternative persistent storage, as this may allow consumer device designers to include second-level persistent caches and achieve volume production. Suppose an alternative persistent technology alternative to NAND flash is developed. In that case, Wikibon expects that this technology will start in the consumer space and work its way up to enterprise computing from there. Volume is king in technology and software, as Wright’s Law shows us.
Bottom Line: Enterprise CTOs should assume that NAND and possibly NOR Flash-native technologies are the primary long-term persistent storage platforms.
The Business Case for Flash-native
10-year IT Detailed Business Case for Flash-native vs. HDD
The 10-year time scale is chosen for the IT business case because most storage systems stay in place well over the initial four or five-year years. This time scale is necessary because of the high-cost cost of installing a new system in parallel, moving the data, and changing the operational procedures. In addition, Wikibon research confirms that most storage systems have been in place for well over ten years.
Table 3 defines the company size and key metrics, the IT budget for the Big Data Mission department, and key business metrics for the Big Data Mission department.

Source: © Wikibon 2021
The top part of Table 3 defines a Wikibon standard mid-size company, with $2 Billion in Revenue, about 6,000 employees, and an average fully burdened salary of 82,500. The revenue supported by each employee is $330,000. The enterprise IT budget is $58 million.
The middle part of Table 3 shows the detailed budget for the Big Data Mission of just over $100K, supporting 11 employees.
The bottom part of Table 3 shows some of the assumptions about the revenue supported by the Big data Mission ($3.6 Million), the number of Terabytes installed at the start of the Big Data project (500 TB), the data starting (1Q 2022), and some calculation of the additional annual revenue support if the productivity of the 11 employees is increased by 10%, 20%, or 30%.
Wikibon has created a detailed HDD and QLC flash storage solution model for a 10-petabyte storage requirement growing 35% per year. The model assumes a global file system for a large number of files. This model is in support of a big data mission. Part of that Model is shown in Table 7 in the Footnotes. Additional assumptions are included in Table 6 in the Footnotes.
The model builds a system from the parts: storage units, storage server units, storage network units, and the racks and space to hold the units. It is built up from a Flash-native and HHD starting point and the other parts of the solution on top of that.
The top half of Table 7 builds a flash solution using the Flash-native data architecture discussed above. The second half of Table 7 makes an HDD solution using the densest HDD architecture possible for Big Data software, starting with 12TB HDDs. Finally, the figures from the detailed model are used to populate Table 4.
The line items in Table 4 also include the software budget benefits because fewer CPU/GPUs are required because of faster storage operations. Software such as Splunk and many databases are often charged relative to the number of CPU cores utilized by the software.
The improved functionality of flash storage allows the IT department to apply a surcharge for faster Flash-native storage. This model uses a 20% increase in chargeback or showback, which lowers IT costs by $0.4 m.
The 10-year IT business case for the Big Data Mission shown in Table 4 is the source of the data in Figure 3 in the executive summary and Figure 9 below.
Source: © Wikibon 2021
Figure 3 in the executive summary above shows an overview of the business case. Figure 9 below shows additional detail. The data for both charts comes from Table 4 above.
The significant differences between the IT costs for Flash-native and HDD come from three components:
- The Equipment Cost – the superior data reduction of Flash-native, the lowering cost difference between HDD and Flash-native, and the better depreciation of flash all contribute to lowering the 10-year cost of storage using flash.
- The Power & Space Rental – The amount of rack space taken by the Flash-native is less today, and the difference will increase over time. The Pure FlashBlade fits a Petabyte in 4U, which shows the equipment & power density that can be achieved with Flash-native storage. The cost of a rack is assumed to be 3K/month. Table 4 shows only one-10th of the racks are needed to contain the Big Data system (0.2 vs. 2).
- System Administrative Costs – Flash-native storage is simpler in architecture and simpler to manage than HDD storage. Administration can be delegated directly to the end-users, as budget authorization is the only issue. In contrast, racks of HDDs need significant work regularly, and there is constant adjustment and discussion between the analytic teams and IT systems administration. A good rule of thumb is that administrate cost is proportional to the number of racks. Flash-native needs fewer people with lower skills and salary levels.
The rest of Table 4 shows the other components of the 10-year IT business case for a Flash-Native vs. HDD solution. The only component that is greater for Flash-native is the storage maintenance cost.
Figure 9 below puts the data from Table 4 into a chart form.
Source: © Wikibon 2021.
The Business Case for the Big Data Mission
The most important reason and value for selecting Flash-native is the ability of the Big Data Mission to create additional value for the business. This additional business value is calculated and discussed in this section.
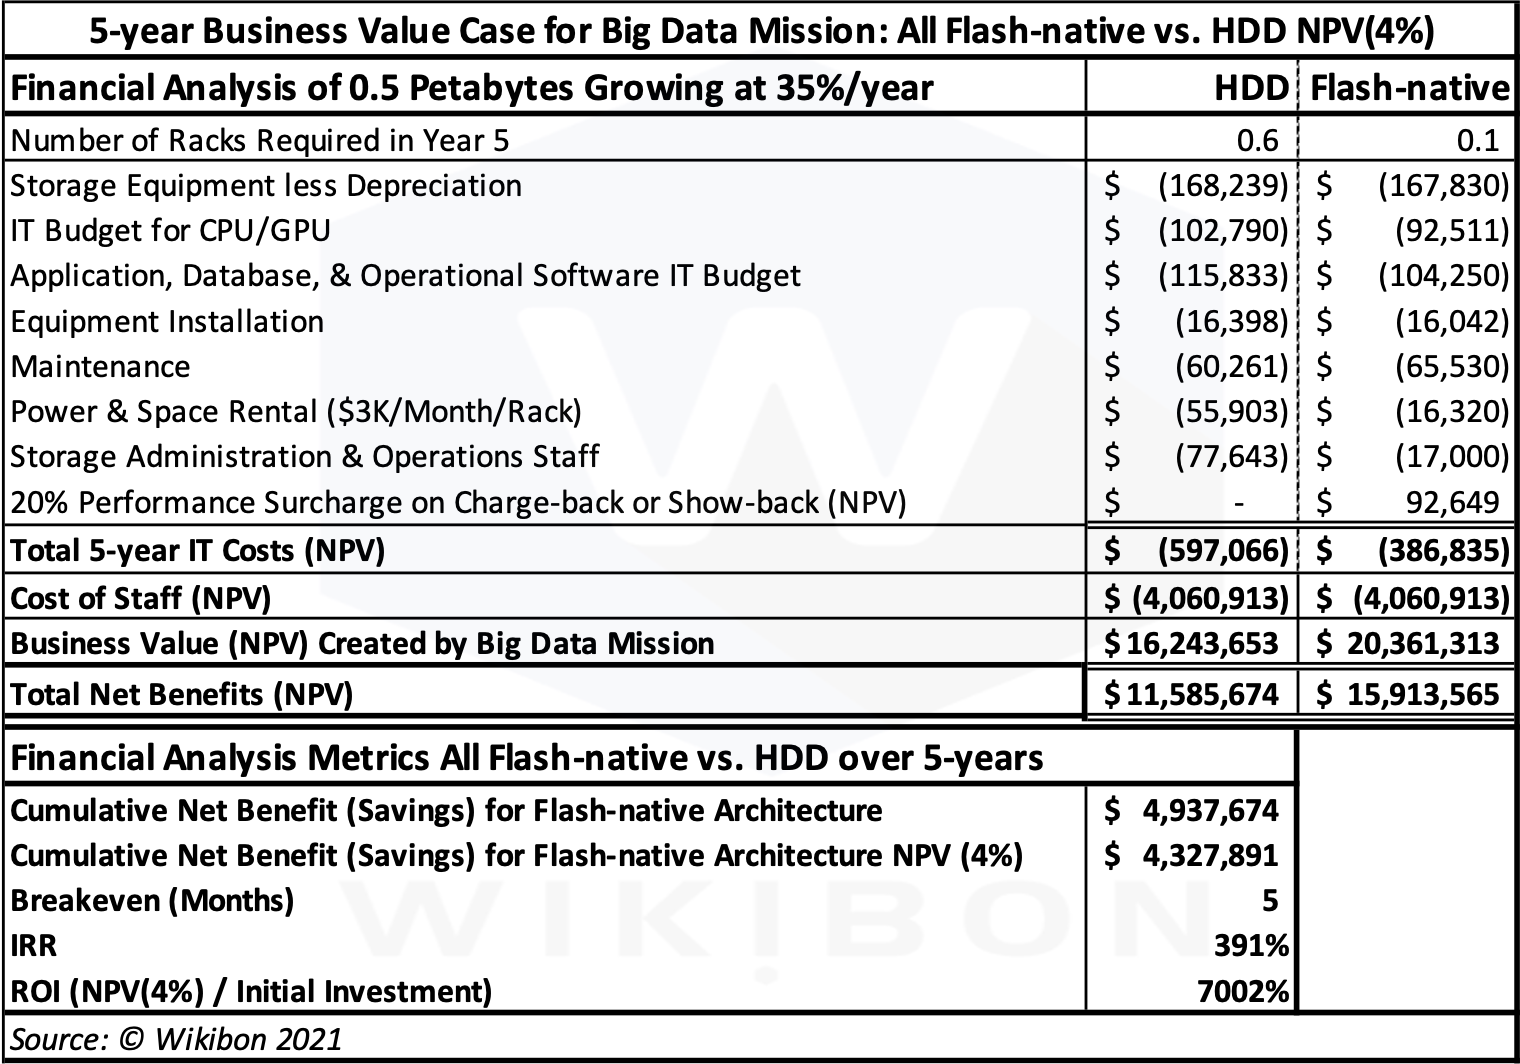
Table 5 below shows the business value case for the Big Data Mission to use Flash-native instead of HDDs. The line items above the Total 5-year IT costs (NPV) line are the same as the previous section. They are shown as costs in this analysis and are therefore negative. The discounted staff costs for the 11 staff over five years are derived from Table 3 above and are shown in the following line. Again, the staff costs are the same for HDD and Flash-native.
Source: © Wikibon 2021
The business value created by the Big Data Mission is derived from the business value of $3.6 million made, shown in Table 3. This figure discounted over five years is the $16.2 million for the HDD Business Value line in Table 5.
This analysis assumes that the IT systems supported by Flash-native storage bring a profound increase in the staff’s productivity and the productivity they deliver to their customers in the company. This productivity is centered on the capability to provide real-time analytics. This real-time data allows business processes that previously were asynchronous to become synchronous. Asynchronous business processes almost always require a skilled person in the loop to evaluate any data problem caused by asynchronicity. Making the business process synchronous allows complete automation of that part of the business process.
Wikibon assumes that using Flash-native storage would enable the same staff in the department to contribute 30% more value. We have assumed a modest start in staff productivity of 5% in month four, and then growing by 2% per month until the 30% improvement is reached. The result of this improvement is that the Big Data Mission can increase the value contributed to the company by $4.1 million discounted over five years. Table 5 shows $20.4 million in the Flash-native column.
The Total Net Benefits line in Table 5 is the sum of the previous three lines. The discounted difference between the HDD and Flash-native columns is $4.3 million. This number is pulled down into the second line of the Financial Analysis section.
The Financial analysis section shows a very positive business case. The cumulative net benefit is $4.9 million, and the discounted cumulative net benefit is $4.3 million. The breakeven is only five months, and the IRR (Internal Rate of Return) is 391%. This business case is excellent. Some CFOs might argue that it would be better to save three headcounts. Wikibon would say that more people should be hired in the Big Data Mission, because of the high return on investment from automation of business processes.
Figure 10 shows the data in Table 5 in chart form. The bottom x-axis shows the HDD and Flash-native discounted costs and benefits and the Flash-native discounted net benefit. The left-hand y-axis shows the 5-year discounted costs of staff salaries (grey) and IT (orange) below the zero line in the first two columns and the added business value (blue) above the line. The third column shows the net discounted Flash-native benefits of $4.3 million.
Source: © Wikibon 2021
The alternative strategy of using HDD will mean that the quality of work produced by the Big Data Group will be poor compared with competitors or other departments doing similar work. As a result, the efficiency of the department and the groups they serve will be less efficient. Previous Wikibon research found that real-time analytics can help both the analytic creators and the end-users be much more productive. Of course, mileage varies, but efficiency in the order of 30% is routinely achieved in these environments after six months.
Table 5 gives us the Big Data Mission key metrics. We can look at the benefits to the Big Data Mission as follows.
- The IT savings over five years are $0.2 million.
- The value to the business is at least ten times greater than the saving to IT.
Wikibon concludes that lines-of-business should immediately initiate Flash-native projects to simplify and automate their business processes and increase their contribution to the business as a whole. Wikibon would also recommend that more staff be employed in the Big Data Mission to reduce the time to roll out automation for asynchronous business processes.
Conclusions & Recommendations
This research looks in detail at the historic storage volumes and applies Wright’s Law to project future shipments and prices for HDD and Flash-native. Our analysis concludes that Flash-native storage will become cheaper than HDD storage by 2027.
This research also shows the impact of Flash-native architectures on IT costs. It is a reasonable business case. However, Wikibon’s clients believe that the real business value of real-time transactions integrated with real-time analytics is to power real-time business processes. Additional business value from the impact of business productivity is more consequential and transformative than IT budget savings. Wikibon indicates the value to the lines of business is at least a factor of 10 higher than the benefits to IT. in addition, Wikibon recommends that lines of business and IT invest in more staff to identify and automate asynchronous business processes and use real-time analytics to upgrade them.
Wikibon expects IT executives to replace HDD enterprise storage with Flash-native storage for all higher value data. In addition, IT executives will start to replace low-value “WORN” data, such as some compliance data with tape with flash front-ends. HDD replacement will take time, and there is always a long tail at the end of any successful technology.
2030 will see the Computer Museum in Mountain View, CA, proudly displaying HDD alongside paper tape, punched cards, and floppy disks as historical storage types. IT senior executives need to make sure they are not similarly consigned.
Wikibon strongly believes that HAMR and MAMR technologies will not deliver in full production volumes. Instead, Wikibon believes that vendors will provide a maximum of 24-28 TB per HDD drive by extending current PSR technology. Figure 8 above shows the Wikibon projections for HDDs and HDD exabytes. It projects that HDD vendors will sell an increasing percentage of the largest HDD drives (Nearline drives with the lowest $/TB), increasing revenue and exabytes delivered and sustaining business operations.
Wikibon believes that NAND flash will be the primary source of innovation for consumers and the data center. Wikibon projects there will be sufficient flash capacity for consumer and datacenter demands. If any silicon-based persistent storage alternatives become available, CTOs should ignore them unless there are clear consumer benefits and volume.
This research confirms that Flash-native architectures can deliver enterprise flash solutions at a lower overall price than HDD storage. The Flash-native architectures can provide highly simplified, low-cost, single-tier, and scale-out storage. This approach eliminates the costs and complexity of tiered storage and makes it easier to manage and automate. Of course, there are caveats; not every workload will see the same benefits.
Wikibon expects cloud vendors and other storage vendors to develop Flash-native architectures and integrate the software and hardware. As a result, Wikibon envisions multiple vendors will offer simplified Flash-native solutions at different performance, functionality, and price points.
Enterprises should expect to have multiple pools of Flash-native storage and should ensure that data shared by a portfolio of applications can remain there for life. HDD data may also be single-tier storage for suitable applications, such as WORN data management.
Wikibon recommends that private and public clouds adopt a strategic plan to implement high-performance disaggregated Flash-native storage architecture. This architecture should be part of an overall data-driven strategy.
Wikibon strongly believes that Flash-native storage will become a fundamental component of massively decentralized computing architectures, comprising distributed data, multi-cloud, heterogeneous compute, and intelligent edge networks.
Wikibon believes that flash-native architectures will accelerate the adoption of next-generation, data-heavy, real-time workloads that transcend traditional analytics. The combination of real-time data analysis and faster transactions can transform business processes through previously unforeseen levels of automation. This real-time transformation should be an integral part of any digital transformation strategy.
Action Item
Senior IT management should ignore vendor claims of new HDD technologies “just around the corner.” Instead, they should assume that flash technology will dominate enterprise storage for the foreseeable future and should implement Flash-native single-tier architectures. In addition, storage investments should focus on combining performance and automated management.
This technical strategy will be an essential enabler of a real-time data-led business strategy that enables real-time applications focused on removing asynchronous business processes. This and other research indicate that the value to the lines of business of real-time analytics is at least a factor of 10 larger than the IT savings.
Footnotes
Table 6 below shows some key assumptions made in the detailed model below in Table 7
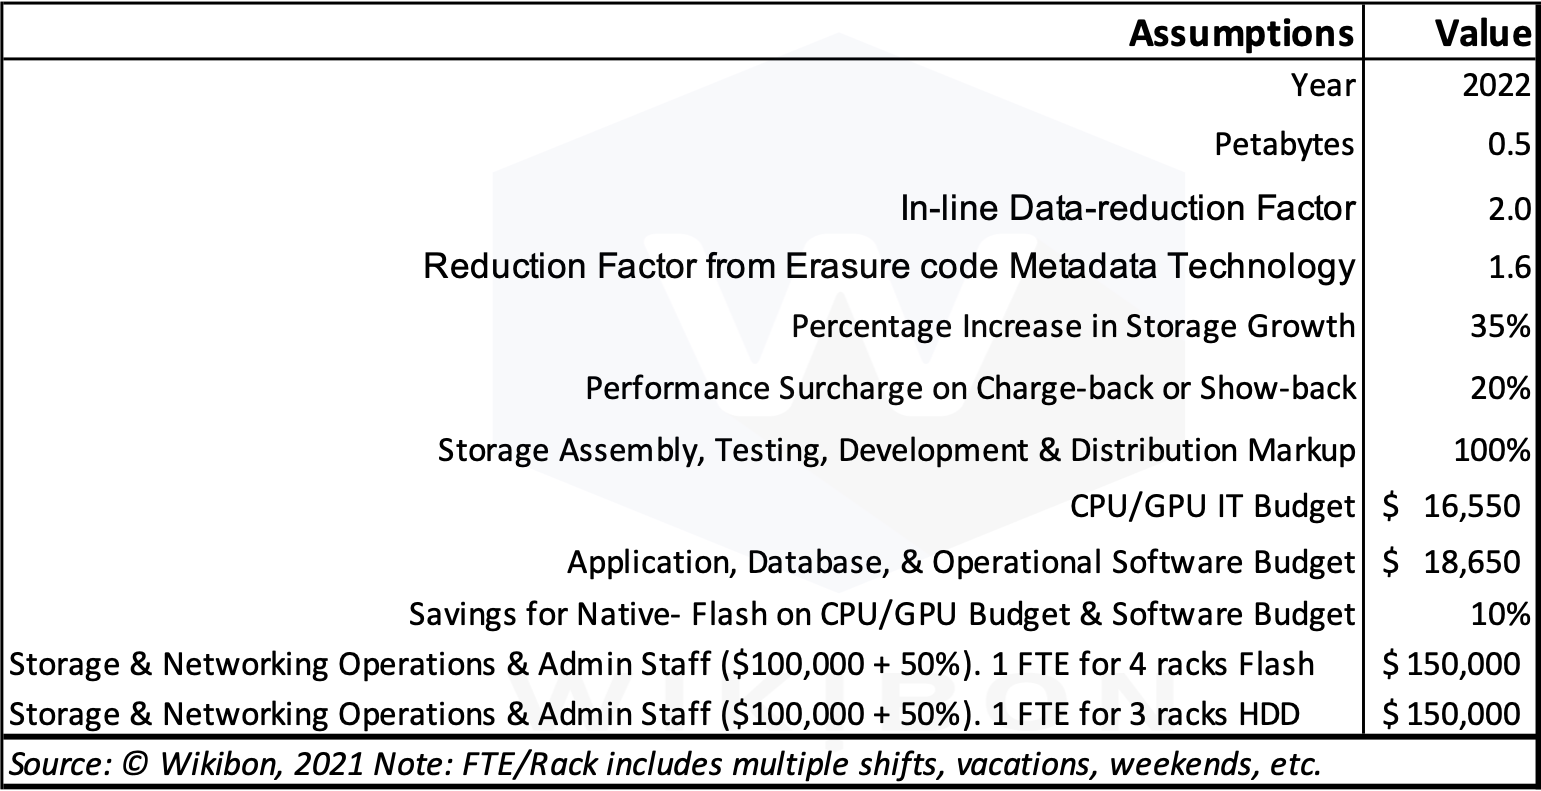
Source: © Wikibon 2021
Table 7 below shows part of the detailed model from which Figure 3 and Figure 9 are derived.
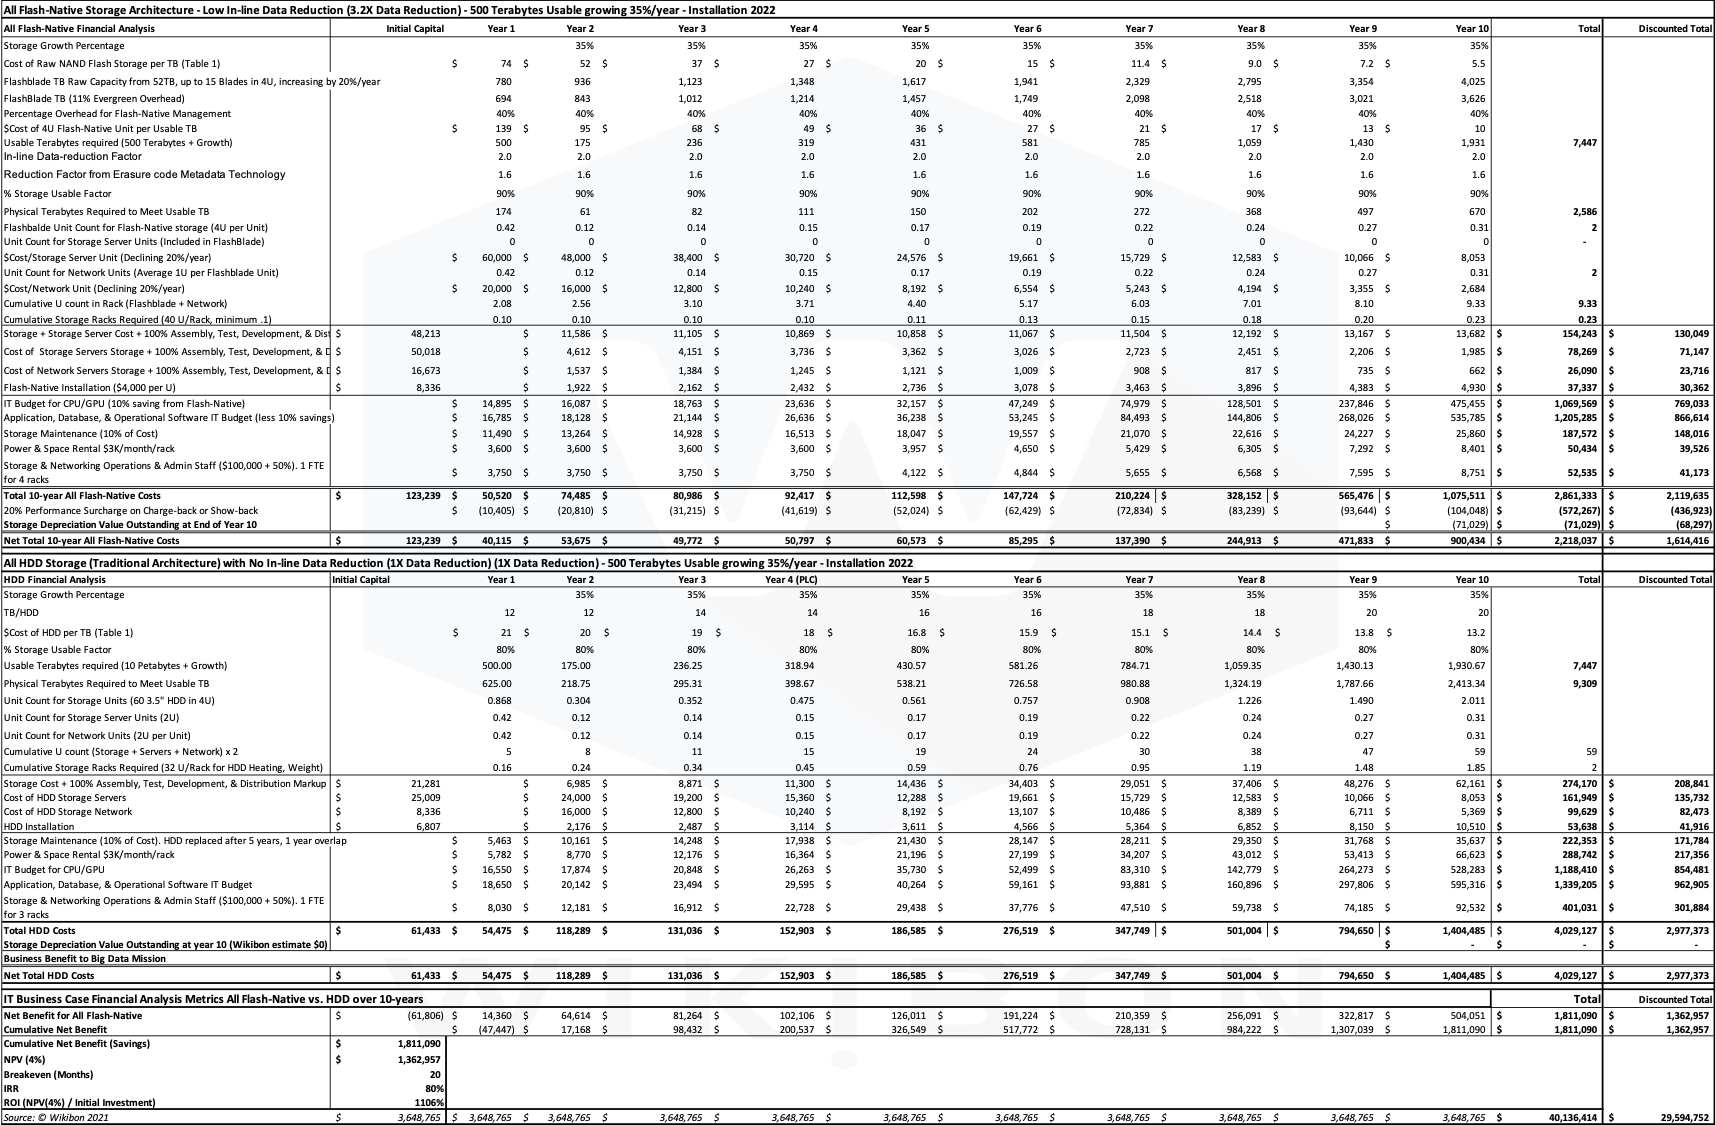
Source: © Wikibon 2021