Premise
This research focuses on how zero loss of data-in-flight leads to certainty of data integrity. This in turn leads to simplified recovery and significantly reduces the chances of IT disasters.
Note: In this report we use the phrase “cost of downtime” and outages interchangeably.
Key Findings
- Failure to recover from failure is the root cause of most IT disasters. Failures will always occur in IT systems. The challenge is ensuring data is not lost, even when the recovery systems are located far from the production systems.
- A critical part of recovery from failure is ensuring data recovery and integrity. When a recovery system is a long distance from a production system, there is “data-in-flight.” This data is easy to lose, and its loss impacts data integrity. Data integrity is essential for recovery of mission-critical systems of record in most enterprises and all financial institutions.
- It is vital to know with certainty if data can be recovered. Certainty results in faster, simpler and more reliable recovery processes. Simplification and increasing certainty allows for automation, which results in fewer extended outages and disasters. Lack of certainty increases financial exposure.
- There are numerous studies and research reports that quantify both the cost of outages and the number of outages that occur annually at organizations. In this analysis we’ve used data from Gartner, Forrester and primary research done by Wikibon. Further details are available in Appendix A and Appendix B below. We’ve analyzed and normalized this data to create a “Model Organization” to reflect a mission critical environment in a financial institution with about $2B in annual Revenue:
- In our model we analyzed and segmented the severity of outgages in three classes (General, Extended and Disaster) as shown below. The following additional assumptions were used as inputs to the model within these three classes of outage:
- Average cost of a General Outage (10 mins to 1 hour) is $44,178
- Average number of General Outages is 30 per year
- Average cost of an Extended Outage (1 to 7 hours) is $11,667/minute
- Average number of Extended Outages is 3 per year
- Average cost of a Disaster Outage (> 7 hours) is $35,000/minute
- Average number of disasters per year is 0.16.
- The probability of at least one disaster in 4 years is 50%.
- Zero loss of data-in-flight reduces the probability of at least one disaster to 18% over a four-year period.
Note: Readers should assess their own environment and evaluate the proximity of their specific metrics to the assumptions we’ve used in this report. As always, feel free to contact us and we’d be happy to adjust the model to reflect your specific situation.
Executive Summary
The cost of downtime due to data loss and unplanned outages at Global 5000 companies ranges from 5-8% of revenue. Digital initiatives and the increasing value and importance of data elevates the imperative to address data loss. Organizations should especially focus on vulnerabilities in mission critical systems with a specific emphasis on eliminating the loss of data in-flight. Doing so can cut the cost of downtime in half over a four-year period.
Source: © Wikibon 2019
IT disasters are very common. In just one industry, five airlines had major outages within the past 36 months. Delta, British Airways, JetBlue, Southwest, and United all suffered significant downtime and attracted negative media attention. Inaccurate excuses are common. For example, British Airways stated that a power system malfunction was the root cause of the disaster. The truth is the root cause was the failure to recover from a power system malfunction.
We know about outages at Apple, AWS, Google, Microsoft Office 365, SalesForce, Symantec Cloud, and Twitter in the last 24 months. All these outages impacted a large number of customers and attracted negative media attention. However, most IT disasters do not reach the press, and we know little about them. Both vendors and IT departments are strongly motivated to be silent.
The key factor tested in this research is the ability to ensure that data integrity is maintained between failure of a primary system and recovery on a secondary system. This is a problem when there is a long distance between the two systems, because there is “data-in-flight,” which creates recovery complexities. If the primary system goes down, the secondary data synchronization may or may not be in line with the primary. This significantly increases the probability of a failure to recover.
In this research we modeled a large financial institution running both mission critical and general business applications. The results of our financial analysis assume the current environment looks like the following:
- A bank with assets of $90B and revenue of $2B
- 2 data centers running 4 Exadatas in each
- Primary data center with a failover
- No ability to guarantee with certainty that data-in-flight is not lost (some ability to reduce the probability of losing data-in-flight)
We compared this current state with a scenario that adds a capability to ensure that no data in flight is lost. The solution we modeled was based on an Axxana Phoenix box to protect the Exadatas. A further discussion of the impact of the Axxana solution is included below.
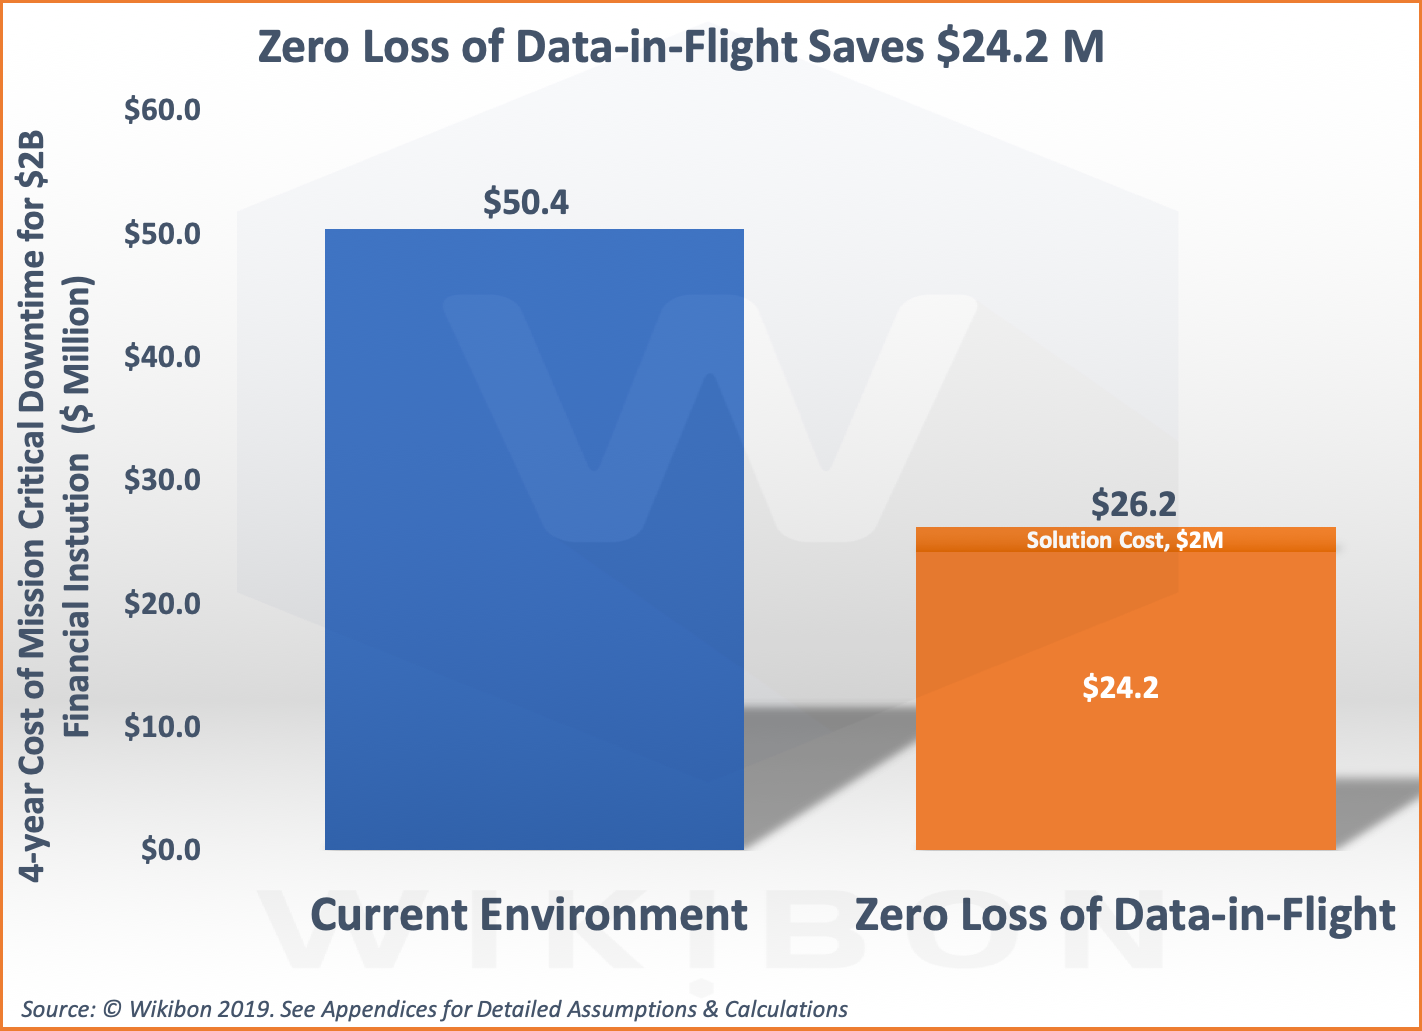
Figure 1 below is a summary of the findings of this financial analysis. The left-hand column of Figure 1 shows the current expected downtime loss from outages is $50.4 million over 4 years. The assumption on the left-hand side is that there is no ability to guarantee consistency between the primary and secondary sites. It is assumed there will be equipment to reduce the probability of in-flight data loss.
The right-hand column in Figure 1 shows the cost of the solution over 4 years ($2M). Underneath is the cost of downtime with zero loss of data-in-flight ($24.2M). The cost of downtime is much lower than the cost of downtime in the first column. This benefit is realized because failover can be initiated far faster when the data integrity status is known with certainty. This in turn reduces the number of serious long outages and disasters and avoids the business costs associated with them. The zero loss of data-in-flight capability enhances the existing software and hardware recovery processes and enables future deployments of new function to be more effective.
The business case is strong. The total initial investment required to mitigate data loss in flight is $1.2 million and the total 4-year investment is $2 million. The implementation time for the project is 6 months. The net present value of the savings (NPV, 5% value of money) is $21.5 million, the breakeven is 7 months, and the IRR over 900%.
Why Does Zero Loss of Data-in-Flight Reduces Downtime Costs?
Please see detailed assumptions in Appendix B – Cost of Downtime – Table 3A
Another paper called “Why IT Disasters Happen” looks in detail at the causes of downtime. In particular it looks at the reasons why loss of data-in-flight has been at the heart of recovery processes.
While the overall number of outages remains the same in each scenario of Figure 1, the total number of long outages (e.g. those over ten minutes) is significantly reduced because there is certainty that data-in-flight has not been lost (see caveat below).
As such, IT professionals responsible for recovery can accelerate the diagnosis process, shorten the time it takes to make the decision to failover, which consequently shortens recovery time. As well there is an ability to automate recovery processes because it is known with certainty if data has been lost in flight. If data has been lost, it can be recovered from the Axxana system. If data has not been lost then normal operations can resume.
Moreover, because failovers and failbacks can be done more simply and with confidence, the procedure is done more often. The quality of the training and testing procedures is continuously improved. This supports continuous improvement of the overall recovery process allowing organizations to keep pace with digital innovation.
Caveat: Not all outages can be solved is less than twenty minutes. For example, outages in which communication with the primary site is severed will always take significant time to resolve. There are new types of cyber outages that are truly frightening in the long-term devastation that could occur. The fundamental thesis of this research is that eliminating loss of data-in-flight will reduce the time and complexity of recovery. For high-value mission-critical environments, the value of eliminating loss of data in flight will almost always be greater than the cost.
A Word of caution about this business case. Disasters occur in unpredictable and random patterns. The business case is based on statistical averages. Figure 1 shows expected values. For most years, those savings will be much lower. As discussed later in this research, the probability of a true disaster (defined in Appendix A below) is 16% per year. If there is a disaster, there is a much greater loss, $26 million for each event. To illustrate this point, in a survey of disasters in 55 enterprises, one enterprise is on record as having 4 disasters in three years. If we construct a worst-case scenario of 4 disasters and 6 long outages, the total impact would be $232 million over 3 years (see Appendix B for the detailed data).
In addition to Figure 1 there are four probabilities that are a better summary of the benefits of zero loss of data-in-flight, and should allow senior management to sleep better.
- The probability of a disaster for a system without this capability is 50% over 4 years.
- The probability of a disaster with zero loss of data-in-flight together with the correct integration and reconciliation processes reduces to 18%.
- The probability of a disaster in one year reduces from 16% to 5%.
- The probability of multiple disasters recedes to a very small number.
Tech companies have spent time trying to convince themselves and their clients that they have a solution for data-in-flight. In reality, these solutions are incomplete and make a solution like Axxana attractive. The one caution with respect to the Axxana solution is lack of integration into other vendor recovery solutions. As a result, Wikibon has included the cost and time of implementing integration and reconciliation processes with Axxana into the business case.
Overall, Axxana provides a unique capability of solving the data-in-flight problem. As a result, Axxana enhances existing and future recovery software and hardware and simplifies the recovery processes. Wikibon believes it is the best disaster insurance money can buy.
Data-in-Flight
Almost every primary financial system in the US (and most worldwide) has a failover system at a secondary site more than 200 miles away. This physical distance is a challenge, because there is data moving between the two systems to keep the two sets of data synchronized.
Because of the distance and speed of light physics, the data cannot be synchronized in real time. As a result, the replication is asynchronous, meaning a write occurs quickly at the primary site and then is sent to the secondary location. As such there is data “in flight” between the two data centers.
The management of this data-in-flight is a complex and important problem of recovery. It is a vital component of ensuring overall integrity of the data. The root cause of complexity in managing data recovery directly relates to data in-flight and managing the failover process between the primary and secondary sites.
There have been many efforts by technology companies to address this problem. For example, there exist expensive three data center solutions that attempt to alleviate data loss. Decades ago, the IBM mainframe introduced Sysplex. Oracle has introduced technologies such as Far Sync.
All these solutions reduce the probability of data loss but are not a complete solution (please see Why Disasters Happen). Wikibon has published research on They are all very complex to implement and manage, and each is exposed to a level of uncertainty during the recovery process. Because of the data-in-flight problem, failover cannot be automated with these solutions. The recovery process is very complex and requires highly experienced database and application specialists to resolve. The recovery processes cannot be tested easily or completely. Tests are “staged” events to meet compliance requirements, rather than a systemic way of iterating improvements to improving the reliability of the failover and failback processes.
Eliminating Loss of Data-in-Flight
Axxana (recently acquired by Infinidat) introduced a method of guaranteeing* zero loss of data-in-flight, and therefore ensuring data integrity. It holds the data-in-flight in a fire-proof, flood-proof, crush-proof completely isolated container until acknowledged by the secondary system. In the event of almost any catastrophe, the data can be recovered via network connects, cellular connections, or physically.
The importance of this solution is that data integrity is guaranteed. As a result, there is certainty that the system applications can failover without loss of data or data integrity. In addition, the failover can be automated, and tested on a regular basis. Equally important, the failback system can be automated and tested in the same way.
*Note: as always, nothing in computing is completely “guaranteed”. However, the probability of equipment failure is so low as to be ignored. The processes for recovering the data-in-flight from the Axxana equipment must be integrated with the general recovery processes and fully automated and tested.
Zero Loss of Data-in-Flight Enhances Recovery Systems
Axxana is not a complete data protection solution and does not replace any other part of an existing recovery system. The sophisticated Oracle, DB2 and Microsoft SQL Server database recovery systems are still required. Integrated database hardware and software solutions such as Oracle Exadata offer a simpler and more robust database platform than bespoke system components. The Axxana solution effectively solves one specific problem elegantly and uniquely– i.e. the loss of data-in-flight and the consequential integrity problems caused by this loss. Axxana is a complement to so-called “Engineered Systems” and enhances their value.
Zero loss of data-in-flight enhances all the other equipment, software and process that are required to build a rapid application recovery capability. It reduces complexity, enables automation, and eliminates the need for as many sophisticated staff to analyze the situation.
Most important of all, it significantly reduces the probability that a failure to recover will occur. This significantly reduces the probability of a disaster. It enables potential disaster scenarios to be resolved as extended outages, and extended outages to be resolved as General Outages.
The Business Case for Eliminating Loss of Data-in-Flight
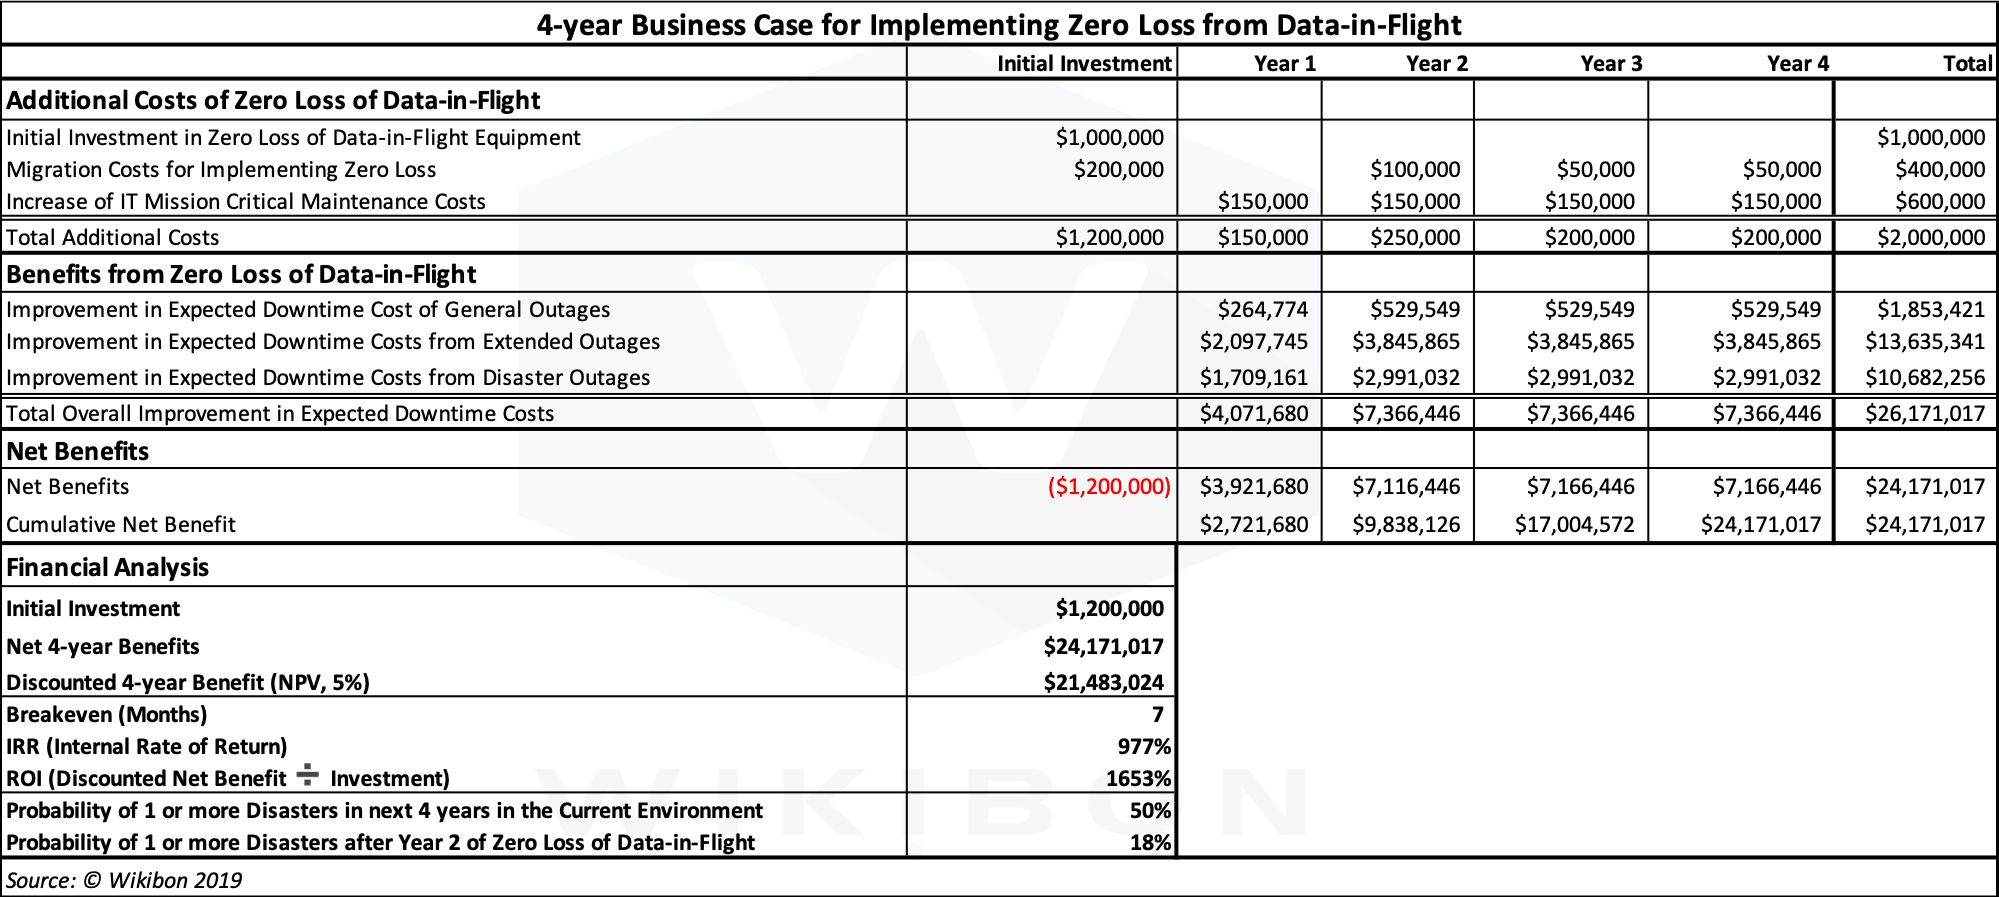
The overall business case with detailed financial analysis is shown in Table 1. The “Total Additional Costs” line shows the initial investment is $1.2 million. The total investment is $2 million over 4 years. This represents the full costs of implementing the Axxana solution.
The benefits section of Table 1 shows the benefits from General Outages, extended outages and disasters. Almost all the benefit is split between Extended Outages ($13.6 million over 4 years), and disasters ($10.6 million over 4 years). “General Outages” are little more than a rounding error at most companies.
In the financial analysis section, the net present value (NPV, 5%) of the expected savings is $21.5 million, the breakeven is 7 months, and the IRR over 900%.
It is important to understand that these benefits are expected benefits. They reflect relatively rare events and will either happen or not happen in real-life. The actual benefit could be anywhere between very low (if you’re lucky) and very high.
The two most important lines in Table 1 are the last two. The penultimate line shows the probability of at least one disaster in the next 4 years for the current environment without zero loss of data-in-flight is 50%. The last line shows that introducing zero loss of data-in-flight (i.e. the Axxana solution) reduces the probability of at least one disaster in the next 4 years to 18%. The Poisson distributions for disasters and extended outages with and without zero loss of data-in-flight can be found in Appendix A. Observers can draw their own conclusions about reducing the probability of multiple disasters in a year.
Source: © Wikibon 2019
Source: © Wikibon 2019
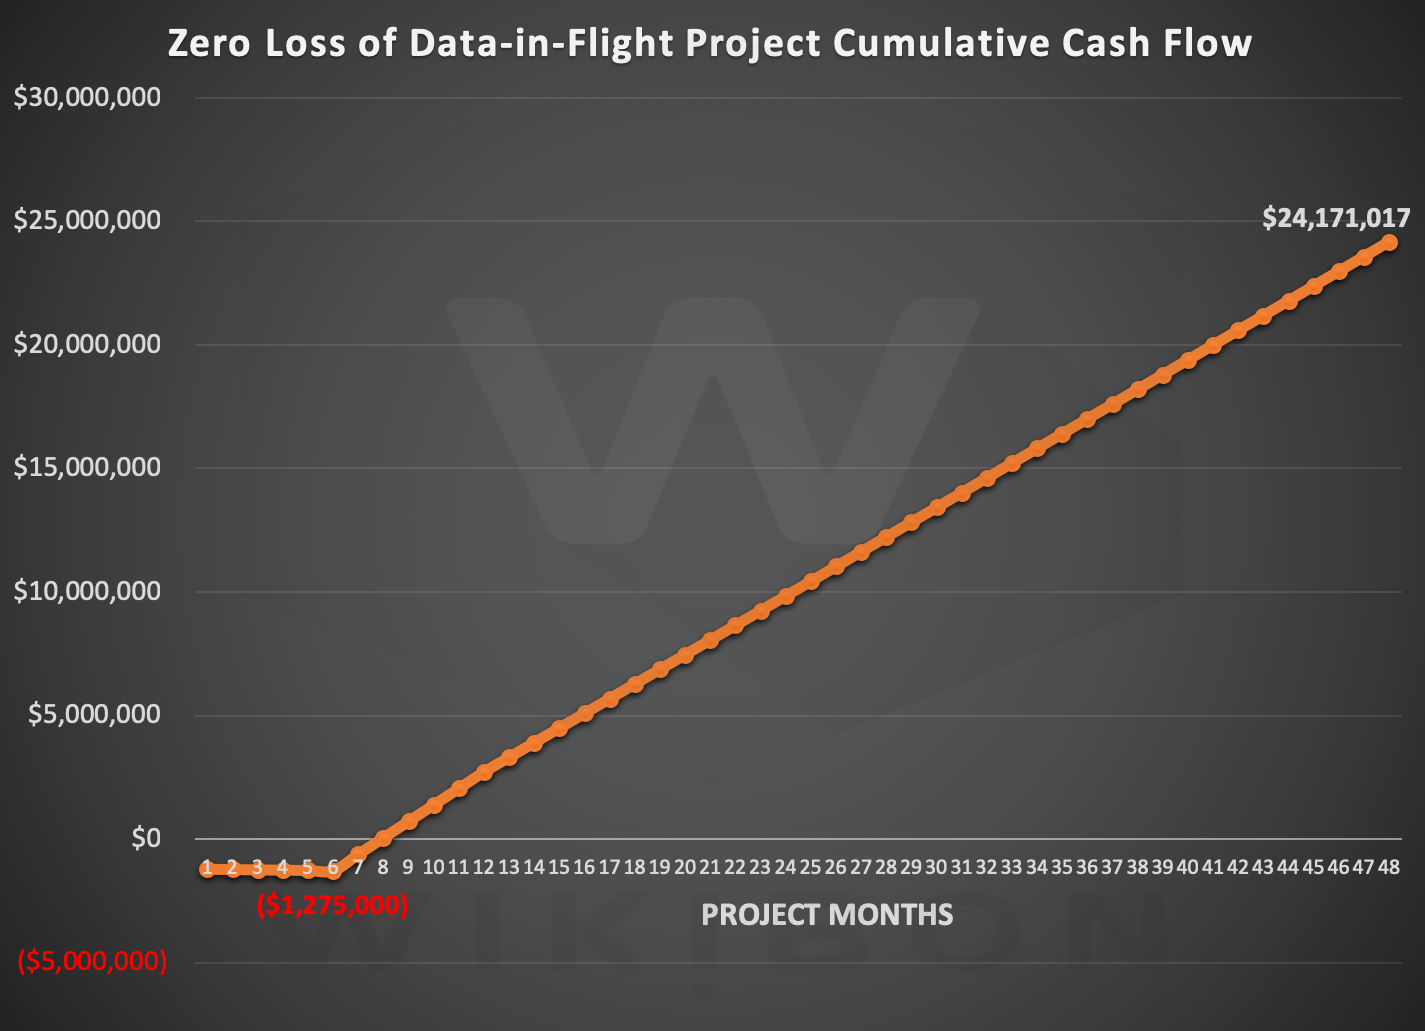
Figure 2 below shows the cumulative cash flow for the project. It shows the initial $1.2 million investment to enable zero loss of Data-in-Flight. The breakeven is shown as 7 months and assumes a six-month implementation time. Once implementation is complete, the project breaks even within one month. The benefits of reduction in downtime costs are $24.2 million after four years.
Note: This analysis assumes an Oracle environment with eight (8) Exadatas and four (4) Axxana boxes across two data centers (i.e. two Axxana systems in each site). Our research shows that conservatively, the reduction in downtime costs scales linearly as you add Exadatas and Axxana boxes. We believe this is a conservative estimate because as infrastructure scales, so does complexity, increasing data loss exposures. This is discussed further in the following section.
Scaling the Solution to Multiple “Pods”
Many large financial organizations split their applications across multiple “pods”, each supporting different processes and different parts of the business. The analysis in this research can be thought of as a pod, and extended to multiple pods. In this case each pod would consist of 8 Exadatas in 2 locations, supporting approximately $1B of revenue with mission critical applications.
A conservative way of estimating the total value would be to assume that all the pods and the business applications they supported were completely independent of each other. Five pods would then support $5 billion in revenue supported by mission-critical applications. The overall net present value of the 4-year benefits of implementing a zero loss of data-in-flight system would be 5 x $21.4 million = $107 million.
However, in reality the applications running in each pod are not completely independent. A disaster in one pod is likely to have some significant impact on other pods. The level of interaction between the pods is often unknown, and often only become apparent only during a disaster. In the British Airways disaster, the staff were not able to rebook flights for stranded customers because the booking system was brought down as well as the ground operational systems. In another case in Europe, a failure of a simple financial monitoring system resulted in the forced closure of the trading systems and GDPR compliance fines.
Wikibon’s research shows that if there were a 10% dependency of each pod on other pods, the overall expected cost of downtime would be a minimum of 45% higher. The expected cost of down time would then be about $18 million/year. The overall net present value of the 4-year benefits of implementing a zero loss of data-in-flight system across the five pods would increase from $107 million to $156 million.
Video Discussion on Hardening Data-in-Flight
SiliconANGLE co-founder Dave Vellante (@dvellante) and Infinidat CTO Doc D’Errico (@docderrico) talk about the Infinisync, based on the Axxana Phoenix “bunker within the datacenter” technology after acquiring Axxana.
Other relevant Wikibon research is “Halving Downtime Costs for Mission Critical Apps” and “Why IT Disaster Happen”
Recommendations
In summary, the focus for reducing the probability of a disaster for mission critical systems of record should include the following six items:
- Deploy the best database software and make full use of distributed database recovery software services.
- Harden Data-in-Flight by deploying zero loss of data-in-flight solutions such as Axxana Phoenix or Infinisync and integrate them with the existing recovery hardware and software.
- Deploying integrated hardware and software components maintained by the same vendor is advantageous. Generally, the more integration the simpler the solution and the greater the availability. The reason for reduced probability of failure in an integrated system is that the vendor can learn over a larger number of instances and incorporate this learning into the software. Note: This analysis includes the Axxana integration and reconciliation costs.
- Focus on reducing the number of steps in the failover process, simplifying each step and then automating every step.
- Deploy and improve excellent change processes for testing software and hardware.
- Automate the recovery of data-in-flight so that failovers can be executed faster and data integrity preserved.
The focus of this research is on the impact of #2, but all the items are important and additive. This research assumes that items 1 and 3 are fully in place.
Note: Axxana is a client of Wikibon and sponsored this research.
Appendix A – Disaster Distributions
This appendix dives into the statistics of rare events.
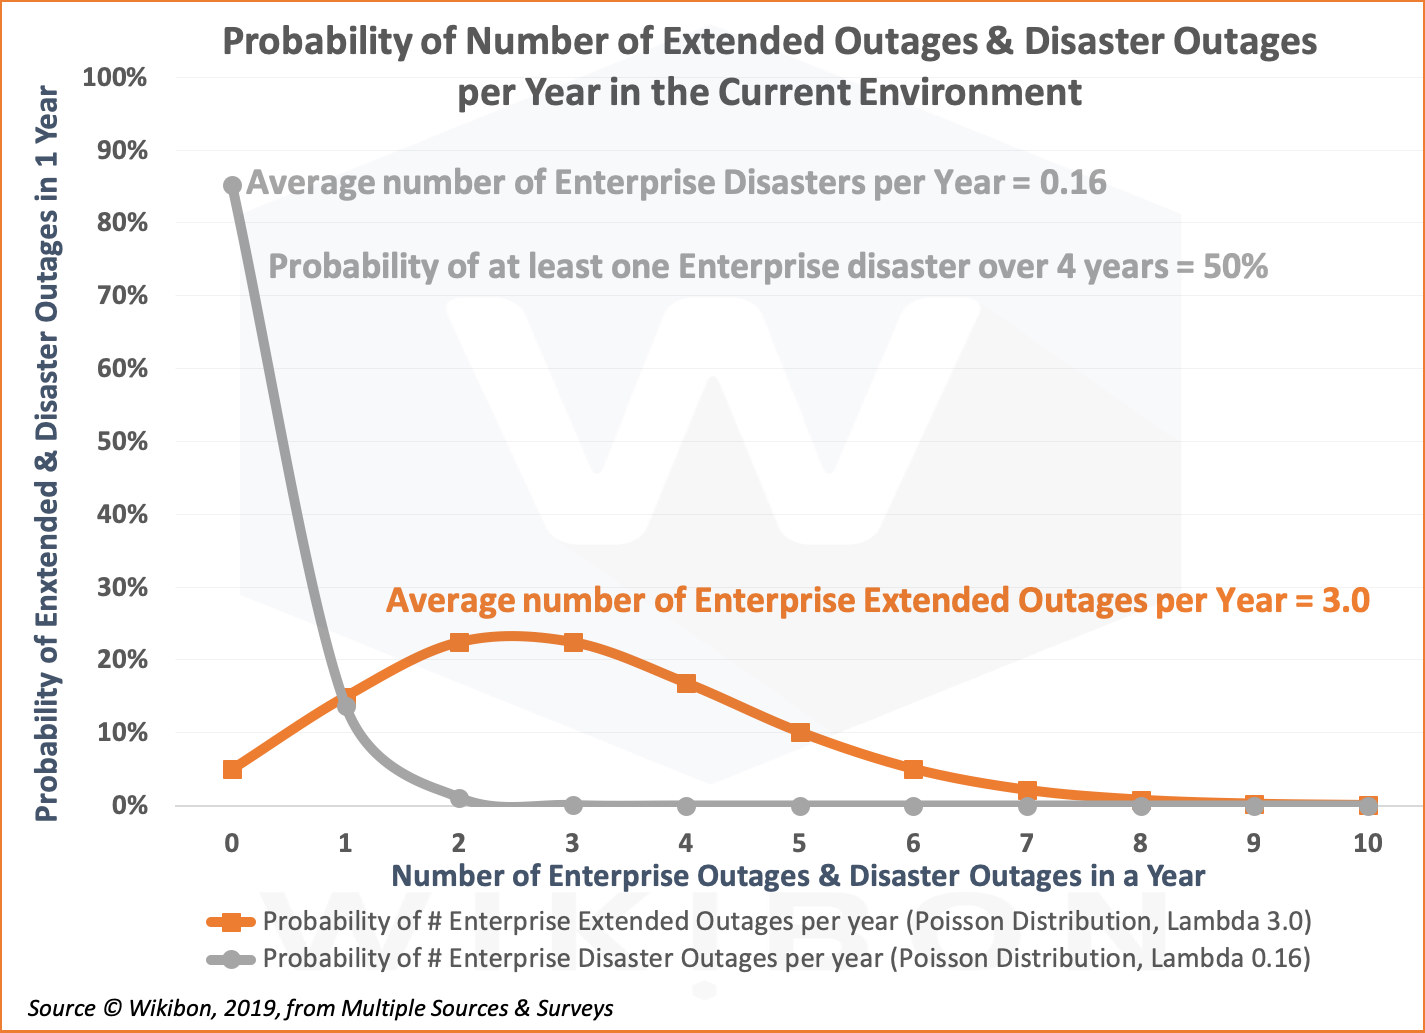
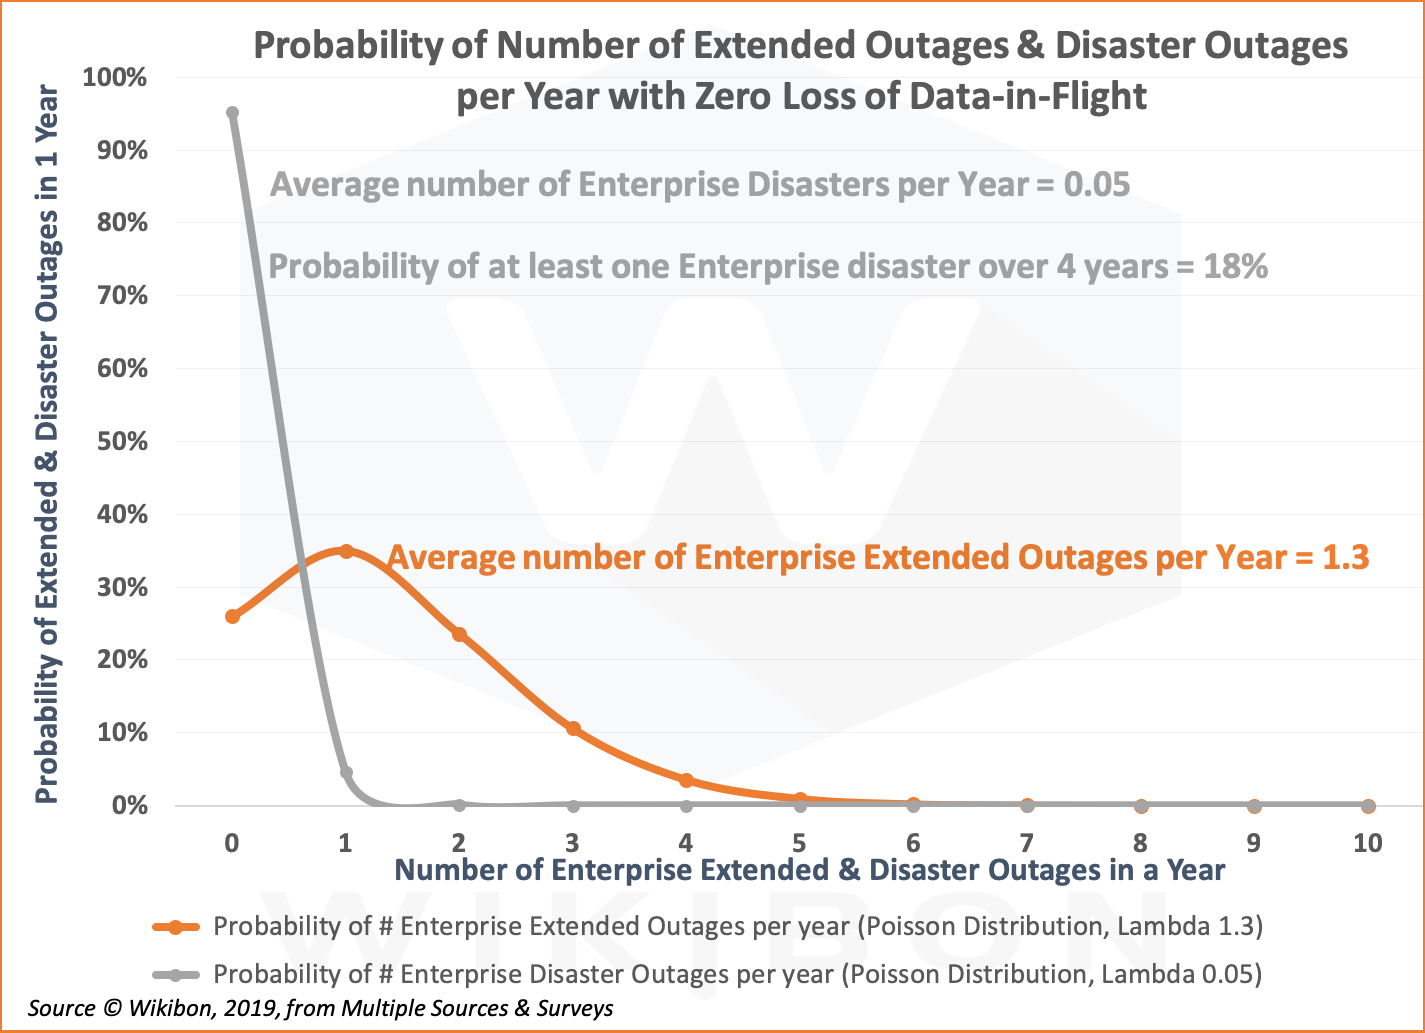
The two Figures below show the Poisson distribution with and without zero loss of data-in-flight. Figure 3 is based on the Wikibon analysis of the 2015 BCM survey. The original data was disasters over 3 years. The data was transformed to be over 1 year and a small correction added to account for the long tail. A lambda of 0.16 for the average number of enterprise disasters per year is derived from that survey.
The chart also shows that the probability of at least one disaster over 4 years is 50%. The formula is 1-((1-0.16)^4).
The same survey gave a median for distribution of extended outages to be 2 & 3 outages. A lambda of 3.0 for the average number of enterprise extended outages per year is derived from that survey data.
Source: Wikibon Analysis of Disaster Frequency in the 2015 Gartner BMC Survey.
Source: © Wikibon 2019
Figure 4 below shows the result of introducing zero loss of data-in-flight. The enhancement to the existing software and hardware recovery systems, together with the improved simplicity.
The Lambda for the average number of enterprise disasters per year is reduced from 0.16 to 0.05. The probability of 0 disasters improves from 85% to 95%, and the probability of multiple disasters is reduced significantly.
In the same way, the Lambda for the average number of extended outages per year is reduced from 3 to 1.3. The probability of 0 extended outages in a year improves from 5% to 26%, and the probability of multiple disasters is again reduced significantly.
Source: © Wikibon 2019. Wikibon Analysis of Disaster Frequency in the 2015 Gartner BMC Survey.
Appendix B – Cost of Downtime
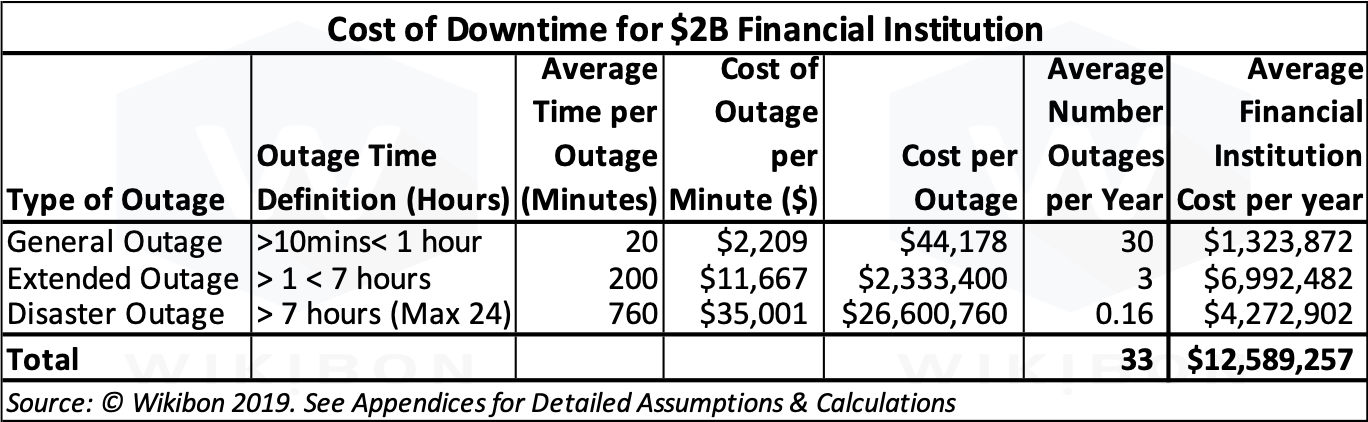
Table 2 below shows the definition and assumptions made in the overall evaluation of the benefits of zero loss of data-in-flight. In the first column are the names given to the type of outage. The second column defines the length of each outage. The General Outage is defined as greater than 10 minutes and less than one hour, the Extended Outage as between one and seven hours, and a Disaster Outage as greater than 7 hours. The third column shows the average time per outage. As an example, the Service Outage is ⅓ of the maximum, 20 minutes of a maximum of 60 minutes. The same principle is applied to the other two outage types.
Source: © Wikibon 2019
The fourth column shows the assumptions made on the financial impact of the different types of outage as a cost per minute. The middle figure was derived from an in depth study by Forrester on 8 enterprise customers with an average revenue of $2 billion. On page 11 of this study, the average cost of downtime per minute is shown as $11,667. This amount represents unrecovered loss of revenue, and specifically the gross profit associated with that revenue. The disaster line was assumed to be three (3) times higher than the extended outage. This is in line with other estimates. The General Outage was derived from a Gartner estimate of $994,000 per hour for fortune 1,000 financial institutions (average revenue of $15B). Adjusting for the lower revenue of $2 billion assumed in this study and adjusting to minutes, the assumption used is $2,209 per minute.
The cost per outage in the 5th column is the product of the previous two columns. The average number of outages for extended outages and disasters is taken from Appendix A above. The number of General Outages is estimated as extended outages multiplied by 10. The final column shows that the majority (89%) of the cost of downtime came from outages that were over an hour long.
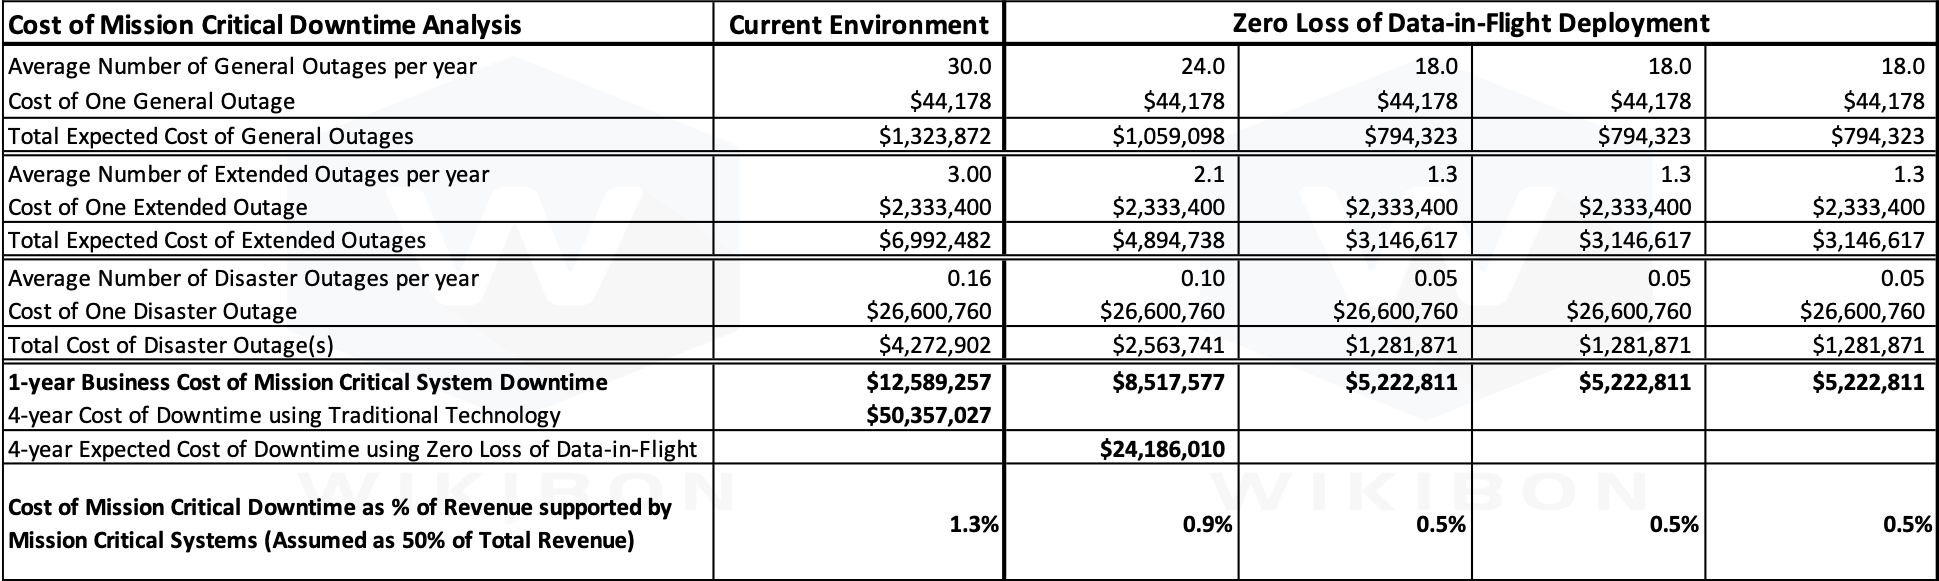
Table 3a below shows the same data as table 2 in the first two columns. The four columns on the right reflect years 1 through 4 of the Zero Loss of Data-in-Flight alternative. The first year of the four reflects a 6 month deployment time, and a ramp up of benefits. Steady state is reached in year two (2). The impact of the benefits is much higher in disaster situations and extended outages.
Source: © Wikibon 2019. See Table 5 below.
The analysis behind the benefit analysis in Table 3a is based on the following assumptions, which are derived from real world experiences, discussions and survey data that Wikibon has gathered over the past two plus decades:
- The overall number of outages remains about the same. This include outages under 20 minutes, General Outages, Extended Outages, and Disaster Outages.
- The number of General Outages (over 20 minutes and under 1 hour) decreases by 40%. A couple of Extended Outages become General Outages.
- The number of Extended Outages (over 1 hour and under 7 hours) decreases from 3 to 1.3 (55%) because about 2 outages move from significant to service. Again, shortening the decision time to failover is the most significant cause.
- The number of Disaster Outages (over 7 hour and under 24 hours) decreases from 0.16 to 0.05 (70%) because some Disaster Outages move to Extended Outages. Again, shortening the decision time to failover, fail-over training, and improvement of automated procedures are the most significant causes.
- The overall cost of mission critical downtime decreases from 1.3% (already much lower than the industry average) to 0.5% of revenue.
- A sensitivity analysis was performed on Table 3b and is discussed below.
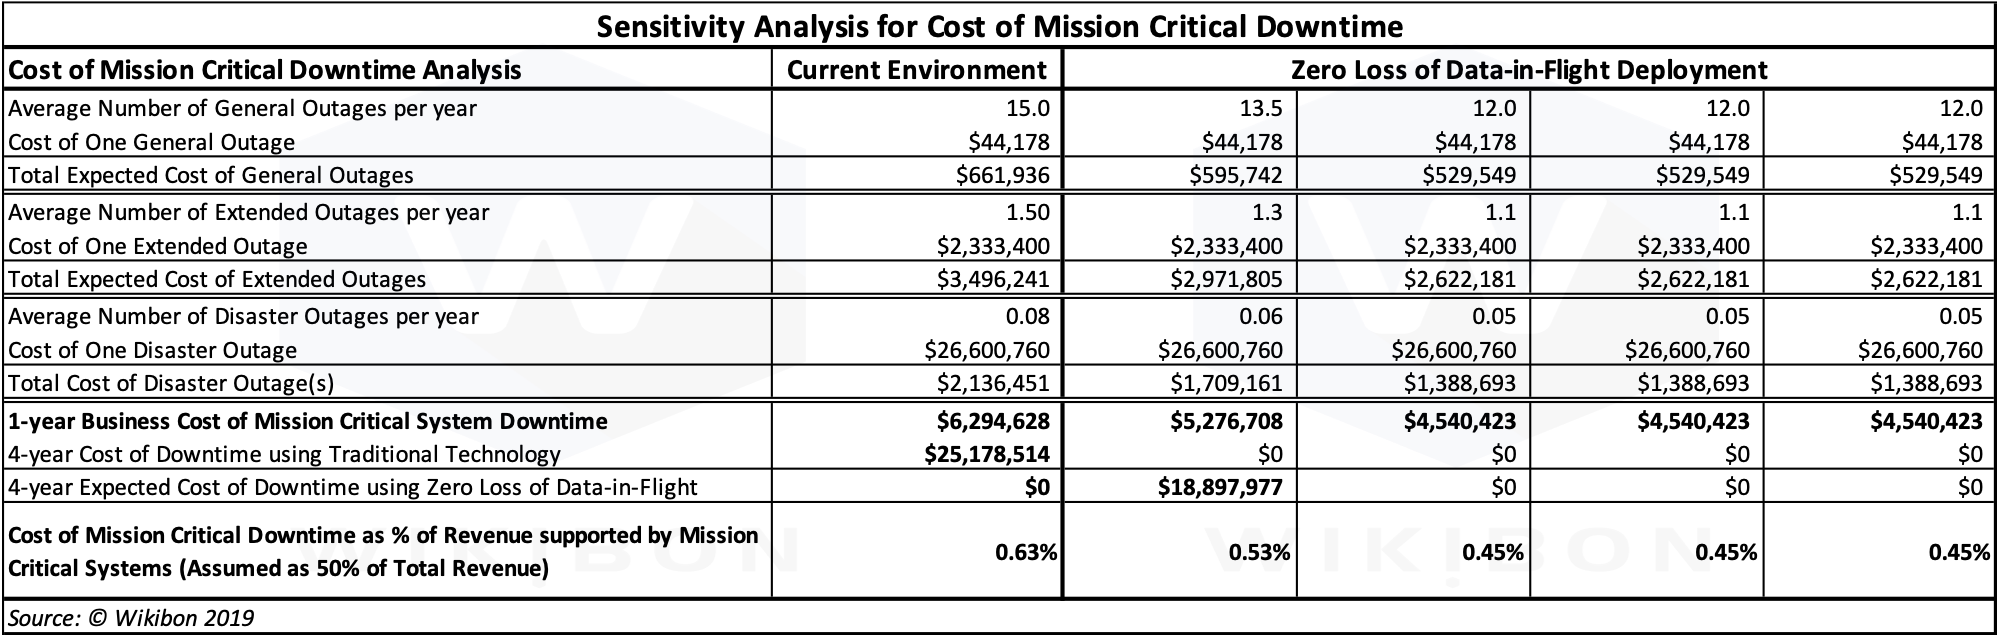
Table 3b below shows the same data as table 3a but with different assumptions as to the number of outages (50% less than Table 3a) and the different improvement rates (half of Table 3a).
Source: © Wikibon 2019. Sensitivity Analysis on Table 3a with reduced number of outages in the current environment, and reduced improvement for Zero Loss of Data-in-Flight entries.
The analysis behind the benefit calculations is in Table 3b is based on the following assumptions.
- The total number of all outages is halved in the current environment compared with Table 3a.
- The number of General Outages (over 20 minutes and under 1 hour) decrease by 20%.
- The number of Extended Outages (over 1 hour and under 7 hours) decreases by 25%. because about 2 outages move from significant to service. Again, shortening the decision time to failover is the most significant cause.
- The number of Disaster Outages (over 7 hour and under 24 hours) decreases by 35%.
- The overall cost of mission critical downtime decreases from 0.63% (already much lower than the industry average) to 0.45% of revenue.
- The revised financial analysis is given in the “Sensitivity Analysis” section in Table 3c below.
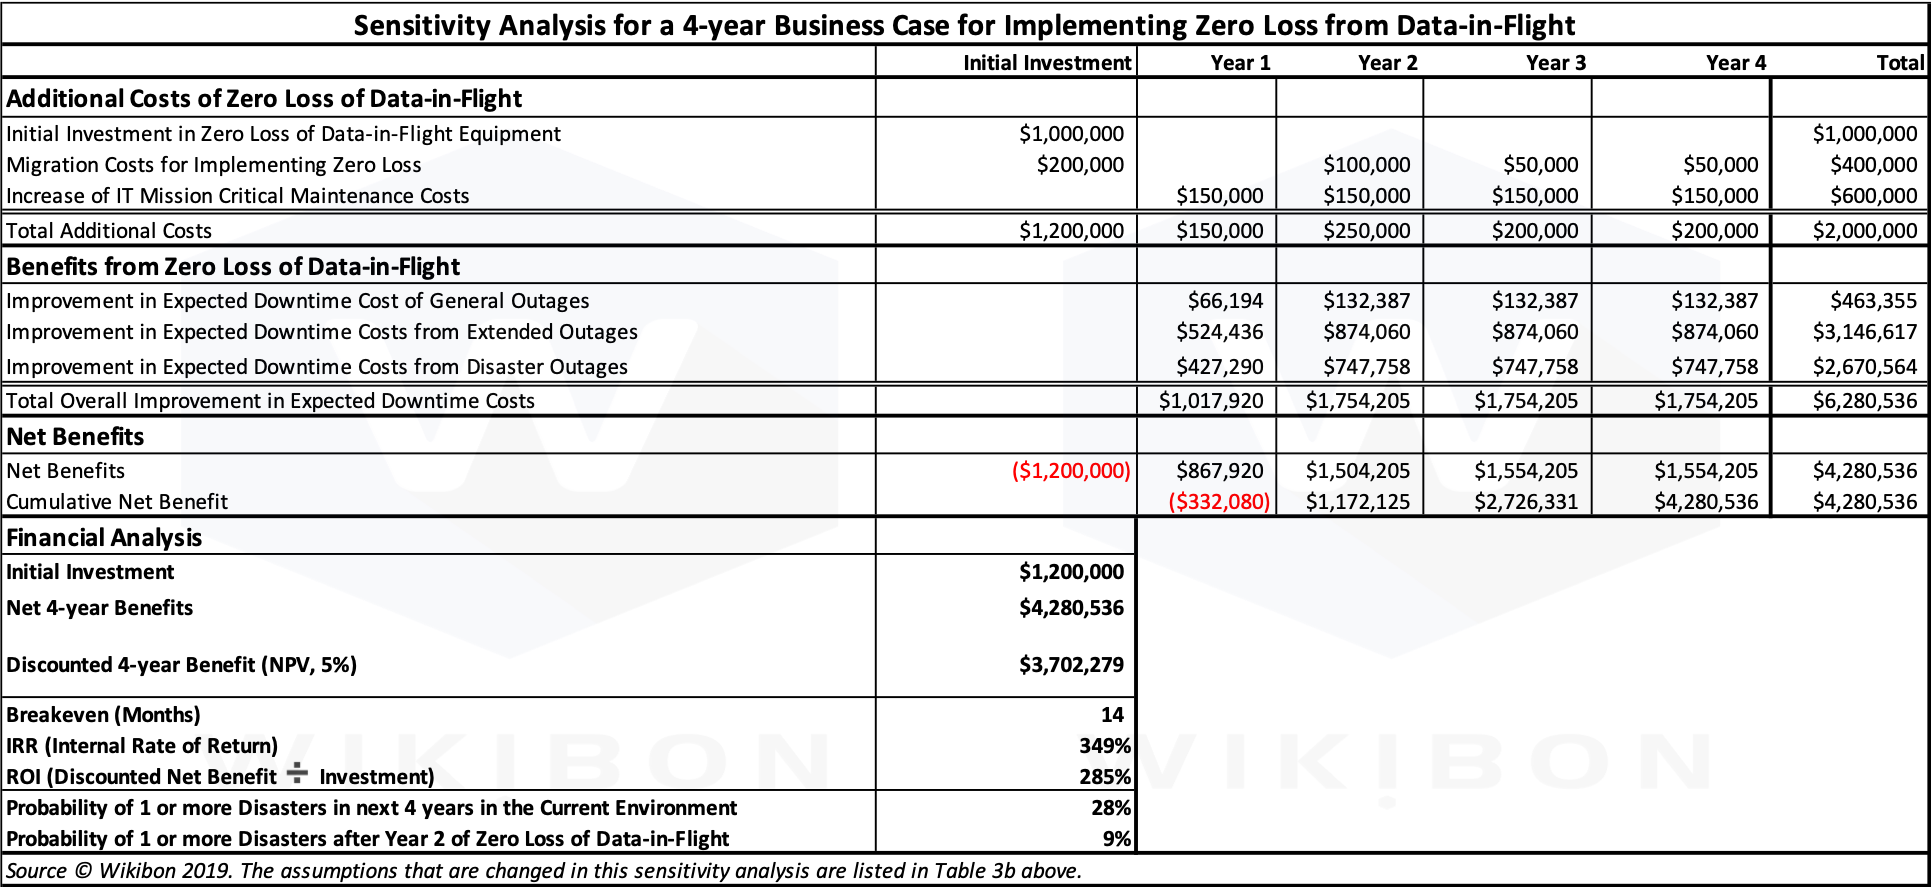
Source: © Wikibon 2019. Based on Table 1 with Sensitivity Analysis from Table 3b.
Table 3c give the business case. The investment is the same as in Table 1 above, $1.2million. The 4-year net benefit is $4.3 million, which is $3.7 million when discounted. The breakeven is 14 months, and the IRR 349%.
This analysis shows that even with enterprises that have invested in ultra-high availability and in automated procedures can still deliver respectable returns on installing zero loss for data-in-flight equipment. Even more important, it reduces the probability of a disaster over a four year period to just 9%.
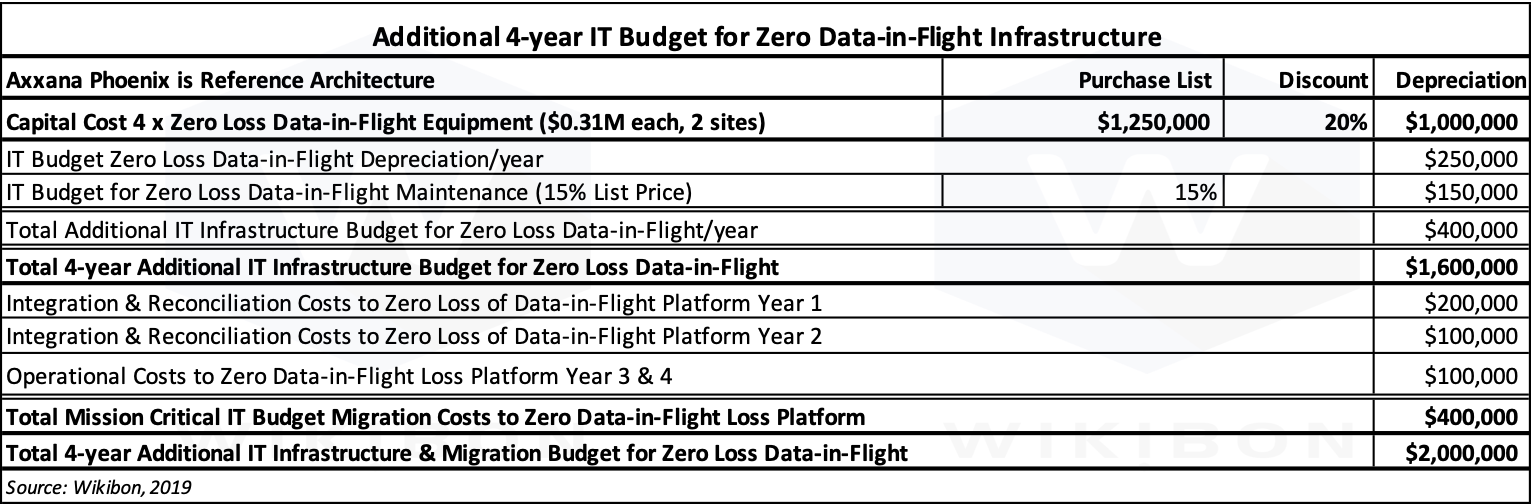
Appendix C – Zero Data-in-Flight Equipment Costs
Table 4 below shows the IT budget costs for enabling zero loss of data-in-flight.
Source: © Wikibon 2019
Table 4 (Caption – Table 4 – Capital, Budget, Migration, and Operational Costs of Axxana Equipment to achieve Zero Loss of Data-in-Flight)
The list price of 4 Axxana Phoenix units is assumed to be $1.25 million, the street price is assumed to be $1.0 million, and the IT budget impact is purchase price depreciated over 4 years. The total integration and reconciliation costs is $300,000 spread over years 1 and 2, and the time to deploy is 6 months. The operational costs after deployment are $50,000 in years 3 and 4.
Appendix D – Cost-benefit Analysis of Zero Loss of Data-in-Flight
Table 5 below shows the 4-year cost-benefit analysis Wikibon model for deploying zero loss of data-in-flight technology in the financial services industry. It brings all the elements previously discussed into a single table.
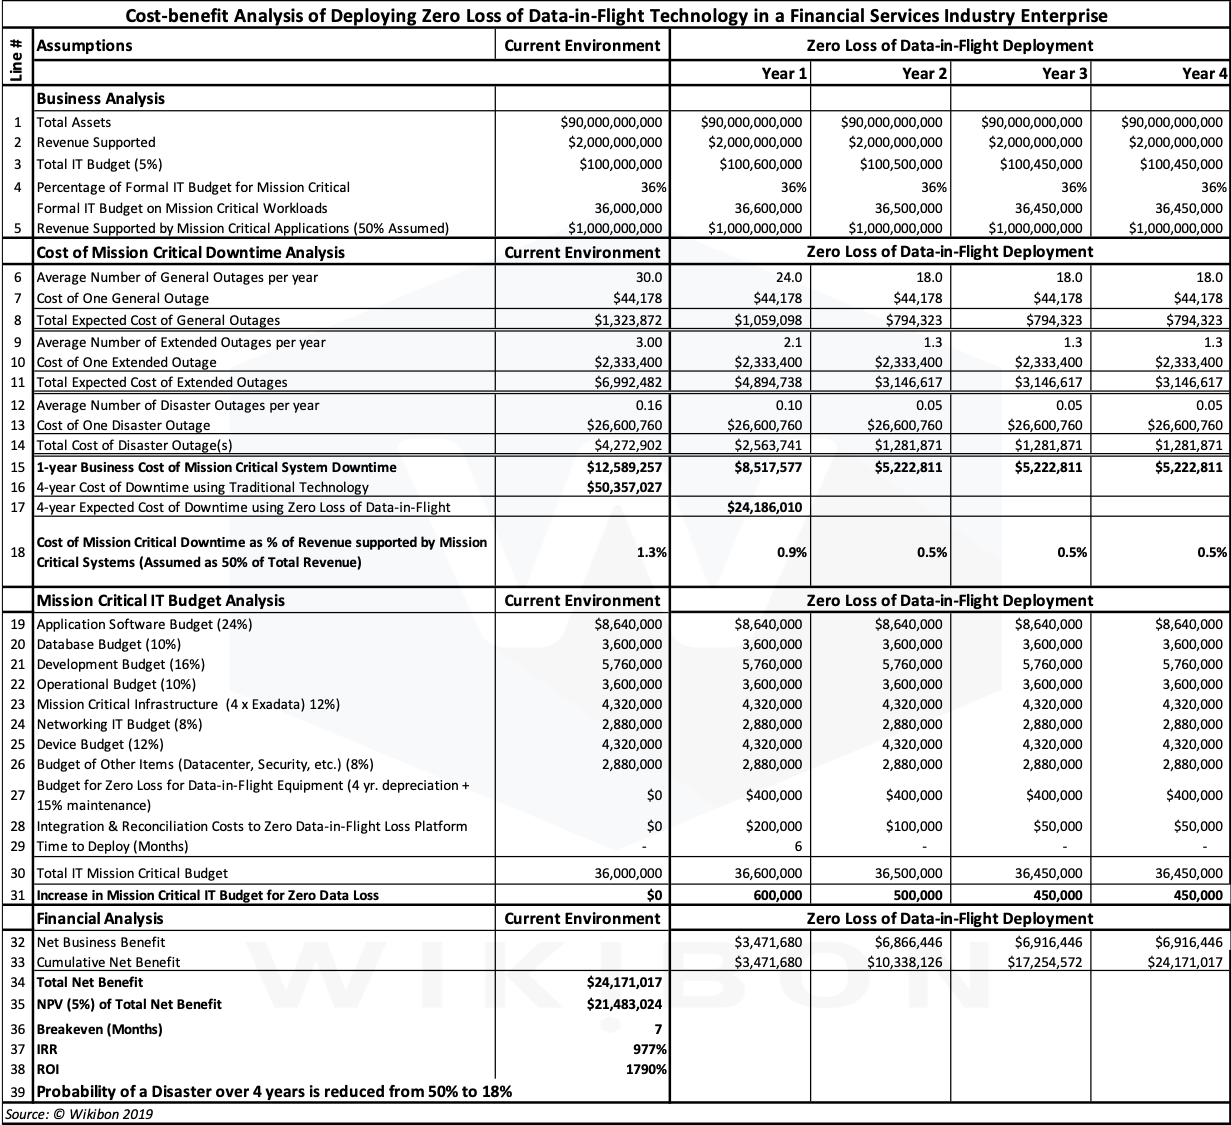
Source: © Wikibon 2019