Executive Summary
Wikibon analyzed the ZS4-4 announcement in December 2014, and has updated this research in the light of the publication of new benchmarks. The SP2 benchmark performance metrics are reasonable measures of storage system performance for intensive sequential large IO workloads such as backup, ETL and large-scale queries. The SPC-2 price-performance metrics are difficult to compare, as the prices are given at the time of submission, and storage systems decline in price over time. Wikibon has time-adjusted the price-performance metrics in all the benchmarks, to enable all the SP2 benchmark metrics to be compared with each other more accurately. The methodology is detailed in the Analysis of SPC-2 Benchmarks section below.
The results of the benchmark analysis are shown in Figure 1 below. The Y axis is the SPC-2 MBPS™ throughput number for the large sequential IO workloads (higher is better). The X axis is the price-performance (See Table 4 for overall price-performance numbers) in reverse order. Better results (lower price/megabyte of data transferred/second) are to the right. The three results on the right (positive green area) are from the two-controller Oracle ZS3 series, the ZS4 series and the ZS4 series x 2.
The two results on the left are from multi-controller storage systems. The HP XP7 (Hitachi VSP) is the highest single-system performer, and has 37% more bandwidth than the Oracle ZS4-4. However, it is 52% higher in price/Megabyte transferred. Even with the price adjustment lowering the purchase price of the XP7 compared with the ZS4-4, the ZS4-4 costs less than half the price of the HP XP7.
The other result on the left is from the Kaminario K2 all-flash array. This result was posted in November 2013, and had the highest score for a single-system until the HP XP7 was submitted. The K2 is not much faster (9%) than the ZS4-4, and even with the significant time-adjusted price-performance measurement, it is significantly more expensive than the ZS4-4.
The ZS4-4 x 2 point on the chart shows a performance 46% greater than the XP7, and 83% greater than the K2.
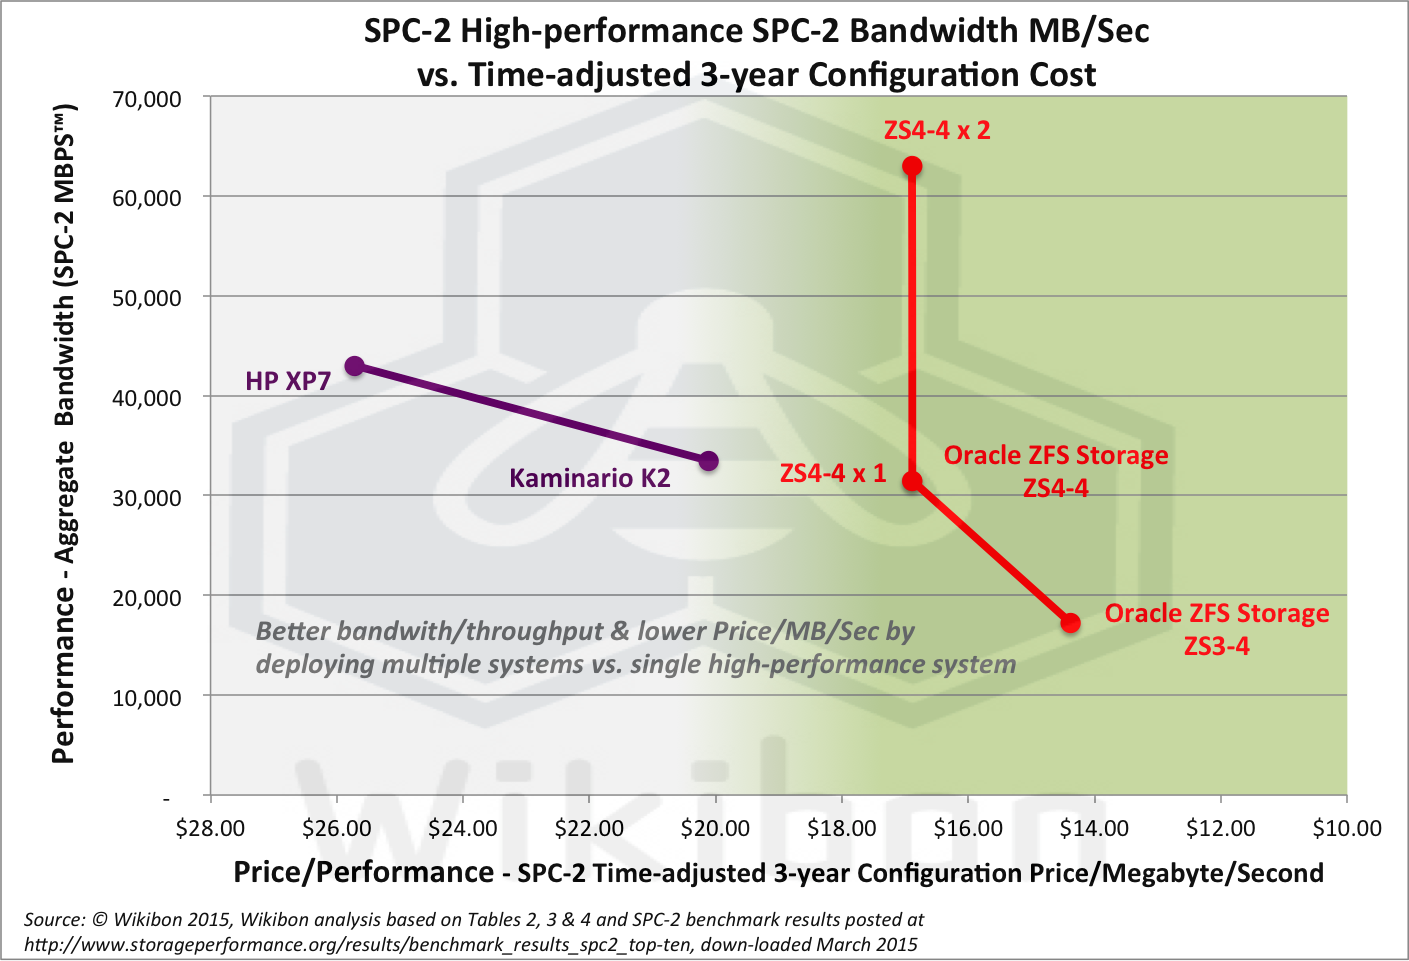
Source: © Wikibon 2015, Wikibon analysis based on Tables 2, 3 & 4 and SPC-2 benchmark results posted at http://www.storageperformance.org/results/benchmark_results_spc2_top-ten, down-loaded March 2015
In the Conclusions section below, Wikibon recommends that for most practical high-bandwidth environments, using one or two Oracle ZS4-4 storage systems will be significantly lower cost and give better performance than either the Kaminario K2 or HP XP7. There may be specific situations such as a very large single database where the HP XP7 single storage system performance may be the only solution. The Kaminario K2 is all-flash, and there can be environments were the data can be shared more effectively on the K2 because of its higher data access density. In general, Wikibon believes that the Oracle ZS3 & 4 storage systems will give better performance and price-performance in most high-bandwidth practical situations.
In the Action Item section below, Wikibon recommends that the Oracle ZS4 and ZS3 be included in all high-bandwidth RFPs.
Introduction
Source: Wikibon 2015
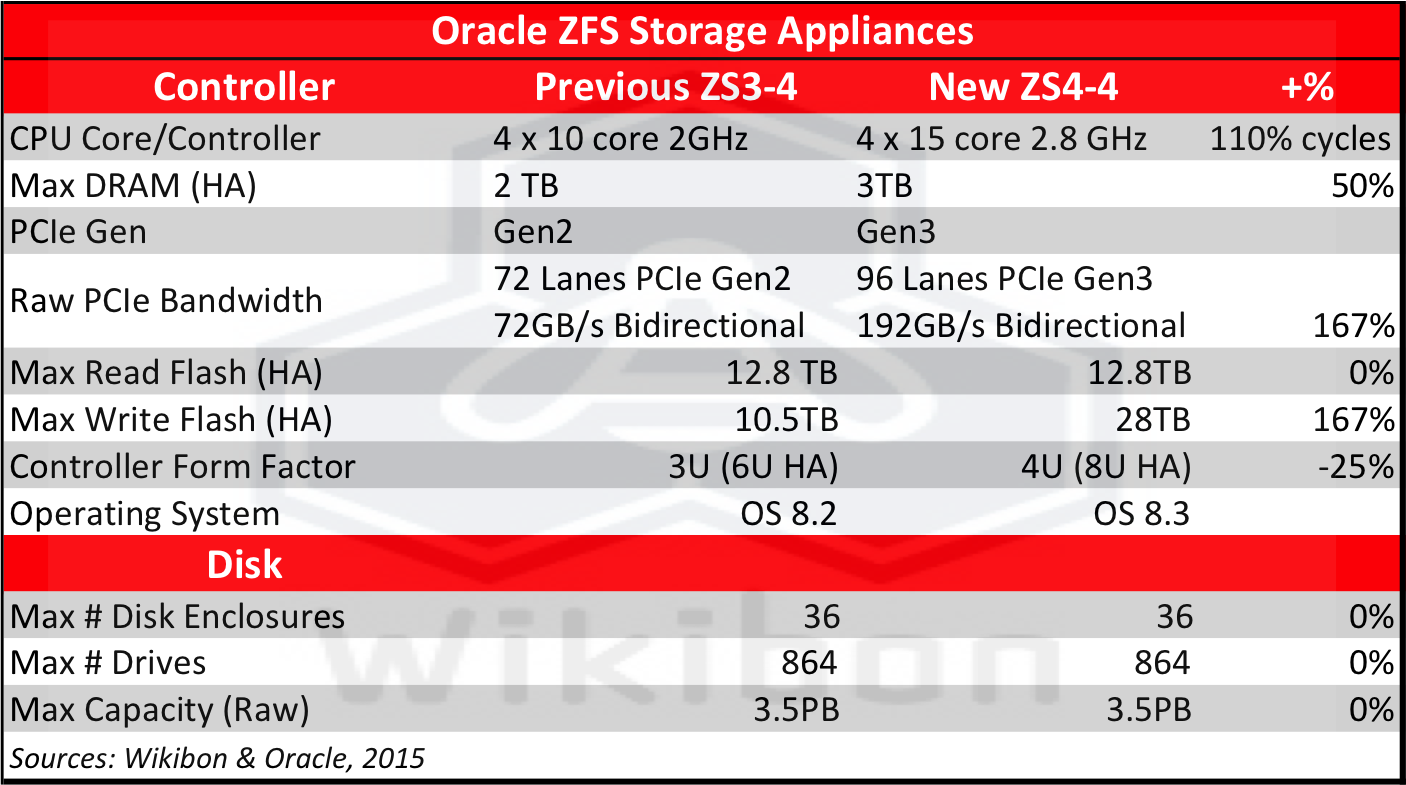
Wikibon analyzed the ZS4-4 announcement in December 2014, and compared the features and expected performance against the previous generation ZS3-4. The comparison chart is shown in Figure 1, which shows a significant increase in faster processor cycles from 50% more cores (110% faster overall), 50% more DRAM in the controllers, a significant increase of 167% in the PCIe bandwidth, and 167% more write flash. In addition, the upgrade to operating system OS8.3 promises significantly improved usage of the processor cores. The previous research concluded that the performance uplift from the ZS3-4 to the ZS4-4 would be in the order of 50% as a conservative initial estimate, with which Oracle concurred.
The results of the SPC-2 bandwidth benchmarks became available on March 17, 2015, and show an 82% improvement in bandwidth performance, with an increase in cost of about 2.1X. This places the Oracle ZS4-4 in same bandwidth performance league as a Tier-1 storage array and an all-flash array, at a significantly lower price/performance point.
Analysis of SPC-2 Benchmarks
SPC-2 Benchmark Description and Key Metrics
The SPC Benchmark 2 (SPC-2) is designed to demonstrate the performance of storage systems for workloads that are characterized by large sequential IOs. It is a bandwidth throughput benchmark, with three components:
- Large File Processing (LFP), characterized by simple sequential processing of large files, including 3 write-only applications and 4 read-write applications. The throughput is measured by the average megabytes/second transferred by the 7 applications.
- Large Database Queries (LDQ), which includes scans and joins of large relational tables, two with 1,024K block size, and two with 64K block size. The throughput is measured by the average megabytes/second transferred by the 4 applications.
- Video on Demand (VOD), which accesses a digital film library. There are a variable number of video streams, and the throughput is measured by the total bandwidth achieved across all the streams.
The key SPC-2 benchmark metrics published include:
- The overall average data transfer rate of the three benchmark components in megabytes/second (SPC-2 MBPS™).
- The Total Price of each benchmark configuration, including 3-year support.
- The overall price-performance of benchmarks, measured as total price ÷ megabytes/second (SPC-2 Price Performance).
- Each component of the benchmark has its own average transfer rate and price performance metrics.
The original data from the top five SPC-2 benchmarks as of March 2015 is found in Table Footnotes-1 in the footnotes below.
SPC-2 Benchmark Performance Results
The top five SPC-2 bandwidth performance rates as measured by the SPC-2 MBPS™ are shown in Table 2 below.
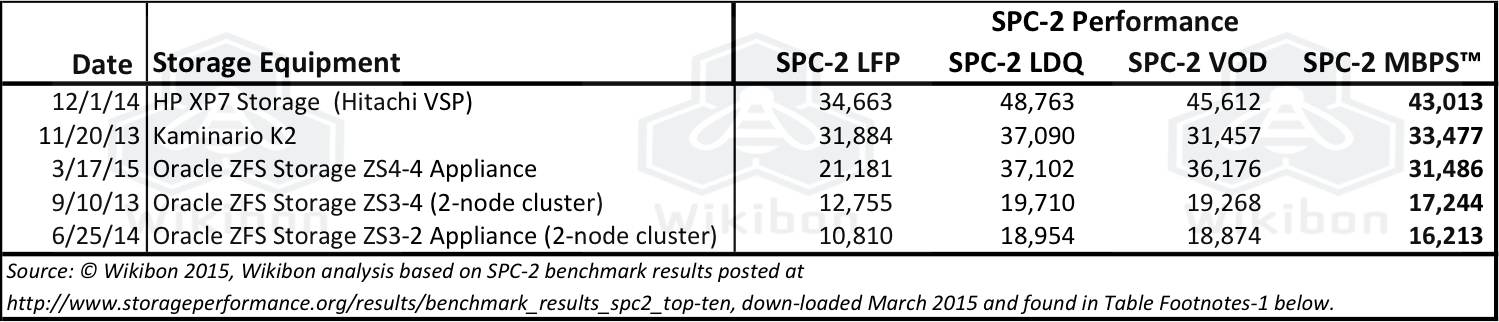
Source: © Wikibon 2015, analysis based on SPC-2 benchmark results posted at http://www.storageperformance.org/results/benchmark_results_spc2_top-ten, down-loaded March 2015
The leading single-system solution is the HP XP7, based on the Hitachi VSP with 4 controllers, with a leading performance of 35K Megabytes/second. The Kaminario K2 multi-controller all-flash array is second with 32K MB/sec, and the Oracle ZF4-4 dual-controller is third with 21K.
Time adjustment of SPC-2 Benchmark Total Price
One problem with the price performance metrics is that the total price is determined on or near the date of the publication of the benchmark. Like all IT technology, the price of storage systems declines year on year. Wikibon took this into consideration in comparing the performance of different configurations by time-adjusting the total price. The yearly decline in price assumed was 25%, or 0.079%/day. This daily rate was applied to the number of days between 4/1/2015 and the publication date of benchmark to calculate a price adjustment factor, as shown in Table 3 below. The Total Price published by SPC is shown in Table 3. The original data for each configuration is shown in Table Footnotes-1 in the Footnotes below. This Total Price number is multiplied by the Price Adjustment Factor to calculate the Time-adjusted Total Price shown in Table 3 below, and used in Table 4 below.
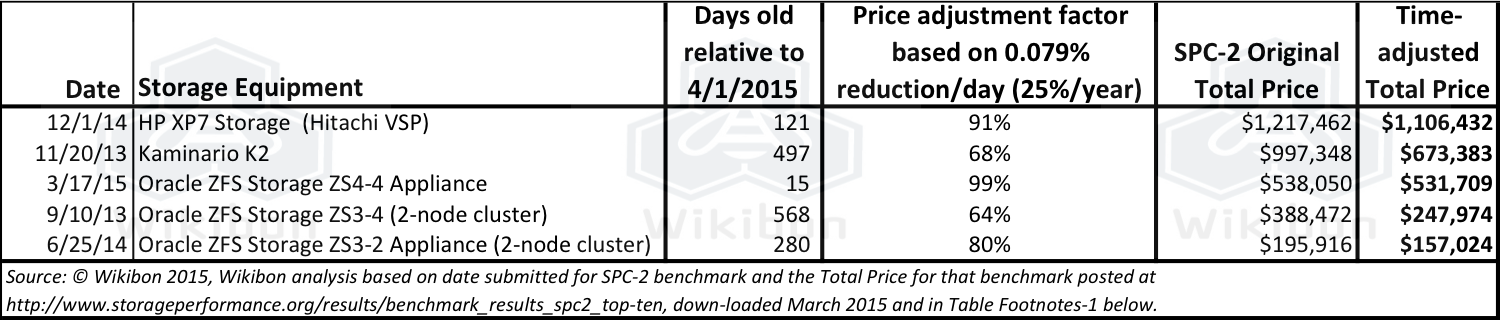
Source: Wikibon 2015, analysis based on SPC-2 benchmark results posted at http://www.storageperformance.org/results/benchmark_results_spc2_top-ten, down-loaded March 2015
SPC-2 Benchmark Price Performance Results
Table 4 below shows the original SPC-2 Performance Figures in Table 2 divided by the Time-adjusted Total Prices figures in Figure 3. Table Footnotes-1 in the Footnotes section has the original price-performance figures without the time adjustment. The end column in Table 4 shows very clearly that the higher the storage system performance (increasing goodness), the higher the price performance (decreasing goodness). The Conclusions and Recommendations section looks at performance and price-performance together, and helps practitioners to understand the business options.
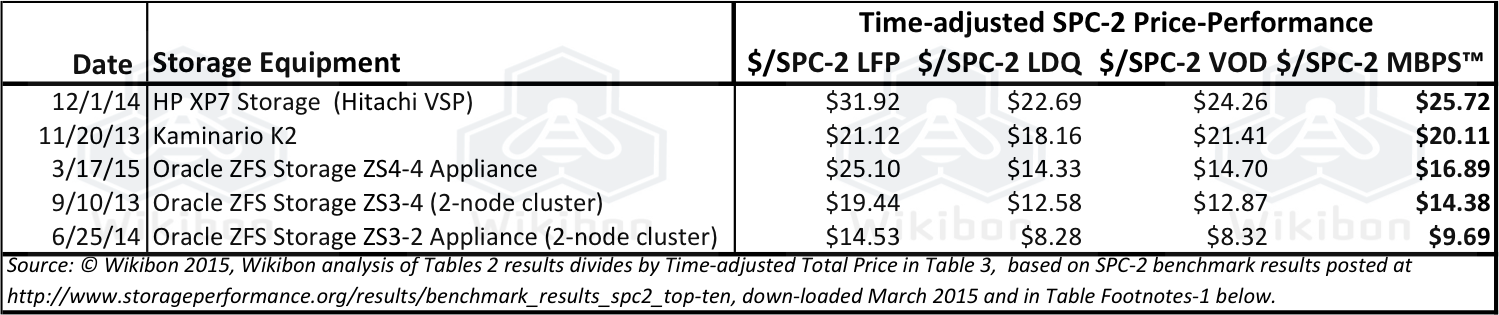
Source: © Wikibon 2015, Wikibon analysis based on Tables 1, 2, and 3 and SPC-2 benchmark results posted at http://www.storageperformance.org/results/benchmark_results_spc2_top-ten, down-loaded March 2015
Conclusions and Recommendations
Conclusions
The results of the benchmark analysis are shown for the top three performance configurations in Figure 2 below. Also included is as a configuration with two Oracle ZS4-4 storage systems. The assumes that the throughput for two systems is twice that of a single system. In reality there is always some inefficiency and overhead with two systems, which becomes much greater when there are more than two systems. However, because the price performance of the ZS4-4 is so much greater than the two larger systems, this simplifying assumption is not going to result in wrong decision making.
There are three metrics presented in Figure 2:
- The left-hand Y axis in Figure 2 is the time-adjusted total cost of the configuration. The blue column shows the value of this metric for each configuration on the X axis. The lower the total cost the better.
- The right-hand Y axis is the SPC-2 MBPS™ throughput number for the large sequential IO workloads. Here, higher is better. The green column shows the value of this metric for each configuration on the X axis.
- The third metric, time-adjusted price-performance, is given as a number for each configuration. The lower the number the better the price-performance.
The HP XP7 (Hitachi VSP) is the highest single-system performer, and has 37% more bandwidth than the ZS4-4. However, it is 52% higher cost/Megabyte transferred, even with the price adjustment lowering the purchase price of the XP7 more than the ZS4-4. The ZS4-4 costs less than half the price of the XP7. The ZS4-4 x 2 column is 4% lower in total price than the XP7, and gives 46% more potential throughput. The K2 is 15% higher in cost than the ZS4-4, with 9% additional performance.
Overall, Wikibon concludes that the HP XP7 has the highest single system performance but is expensive. The Kaminario K2 is about the same in performance as the ZS4-4 and more expensive. The Oracle ZS4-4, ZS4-2 and ZS3-4 storage systems give a broad range of performance options, have good price performance and are well suited in architecture for high bandwidth workloads.
Wikibon also analyzed the difference between the different systems on the different workloads (LFP, LDQ & VOD) that make up the SPC-2 benchmark suite. These are shown in Table 2 above. Although there are some differences (e.g., K2 is better than average on the LFP workload, and ZS4-4 is better than average on the LDQ and VOD workloads), they are not significant enough to change the overall conclusions.
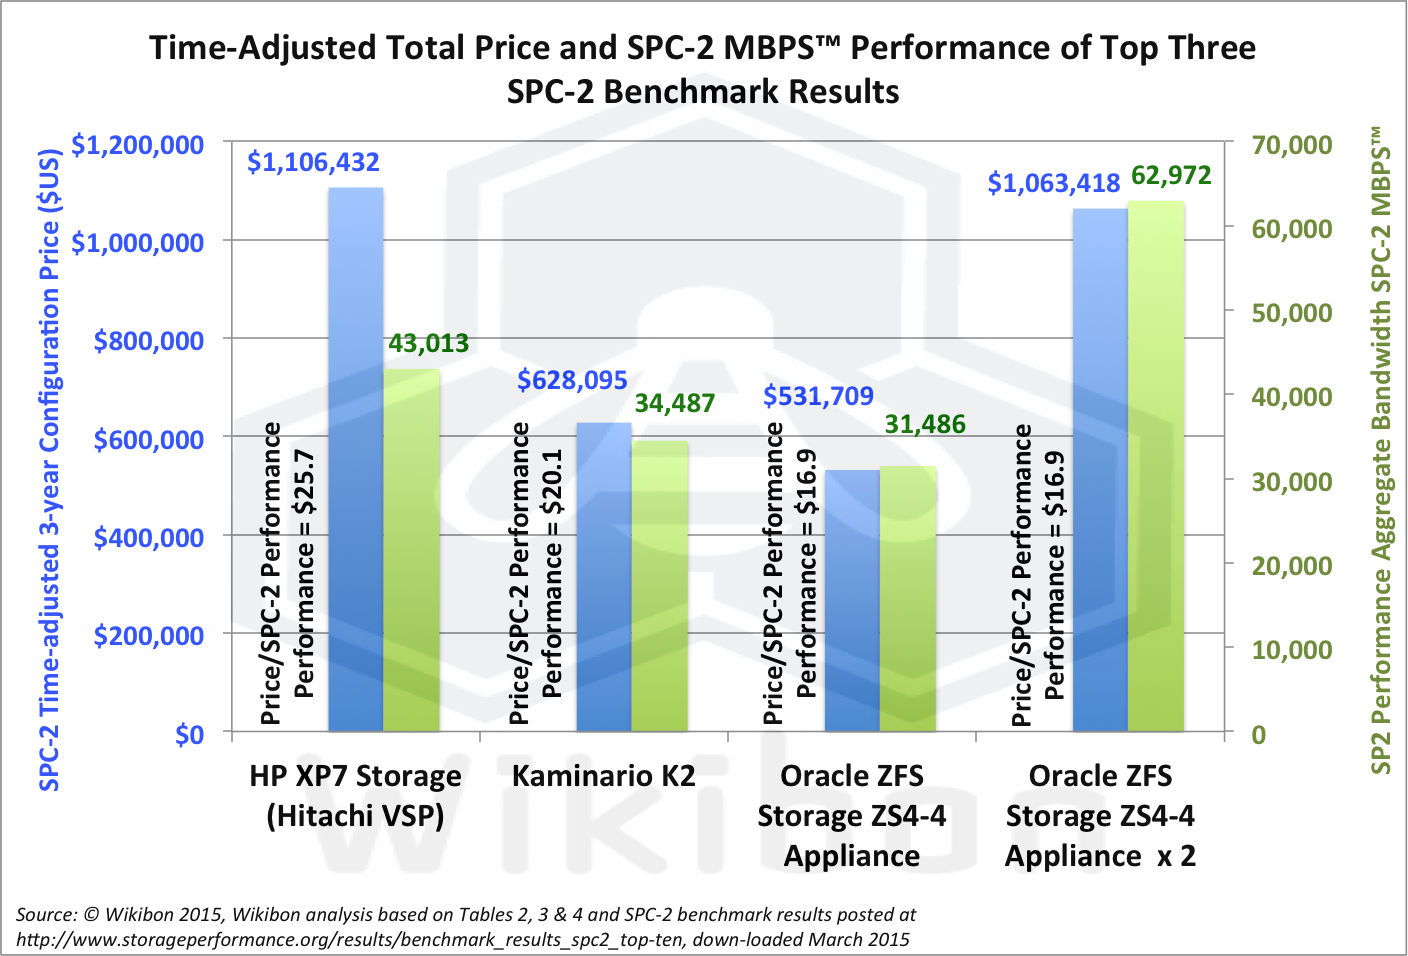
Source: © Wikibon 2015, Wikibon analysis based on Tables 2, 3 & 4 and SPC-2 benchmark results posted at http://www.storageperformance.org/results/benchmark_results_spc2_top-ten, down-loaded March 2015
Recommendations
Wikibon recommends that for most practical high-bandwidth environments, using one or two Oracle ZS4-4 storage systems will be significantly lower cost and give better performance than either the Kaminario K2 or HP XP7.
There may be specific situations where the XP7 single storage system performance may be the only solution. An example of this could be very large single database that cannot be split between two storage systems. The XP7 is also a very highly available Tier-1 storage system that supports mainframes as well as open systems.
The K2 is a scale-out all-flash storage system. Wikibon has discussed environments where data can be shared more effectively on an all-flash array, because of the higher data access density available with NAND flash. The processes and procedures for data sharing are at an early stage of practical deployment, and will necessitate significant operational and organizational change. There are some environments where Wikibon would recommend an all-flash approach.
In general, Wikibon believes that the ZS4-4 and ZS3-4 storage systems will give good performance with lower price-performance in a wide range of high-bandwidth practical situations.
Action Item
Wikibon strongly recommends that the Oracle ZS4 and ZS3 appliances are included in any RFP for high bandwidth workloads with large sequential IO blocks. Relevant workloads include backups, restores, ETL, and large-scale queries.
Footnotes
The Table Footnotes-1 below gives the details of the SPC-2 benchmark downloaded from the SPC website. They show the top five SPC-2 MBPS™ performance benchmarks, in performance order starting from the highest in the left-hand column. The total price in each of the columns is the price at the time the benchmark was submitted. The submission date is given in the first row. This date is used in Table 3 above to calculate a time-adjusted price in Table 3 above, and then the time-adjusted price-performance figures in Table 4 above.
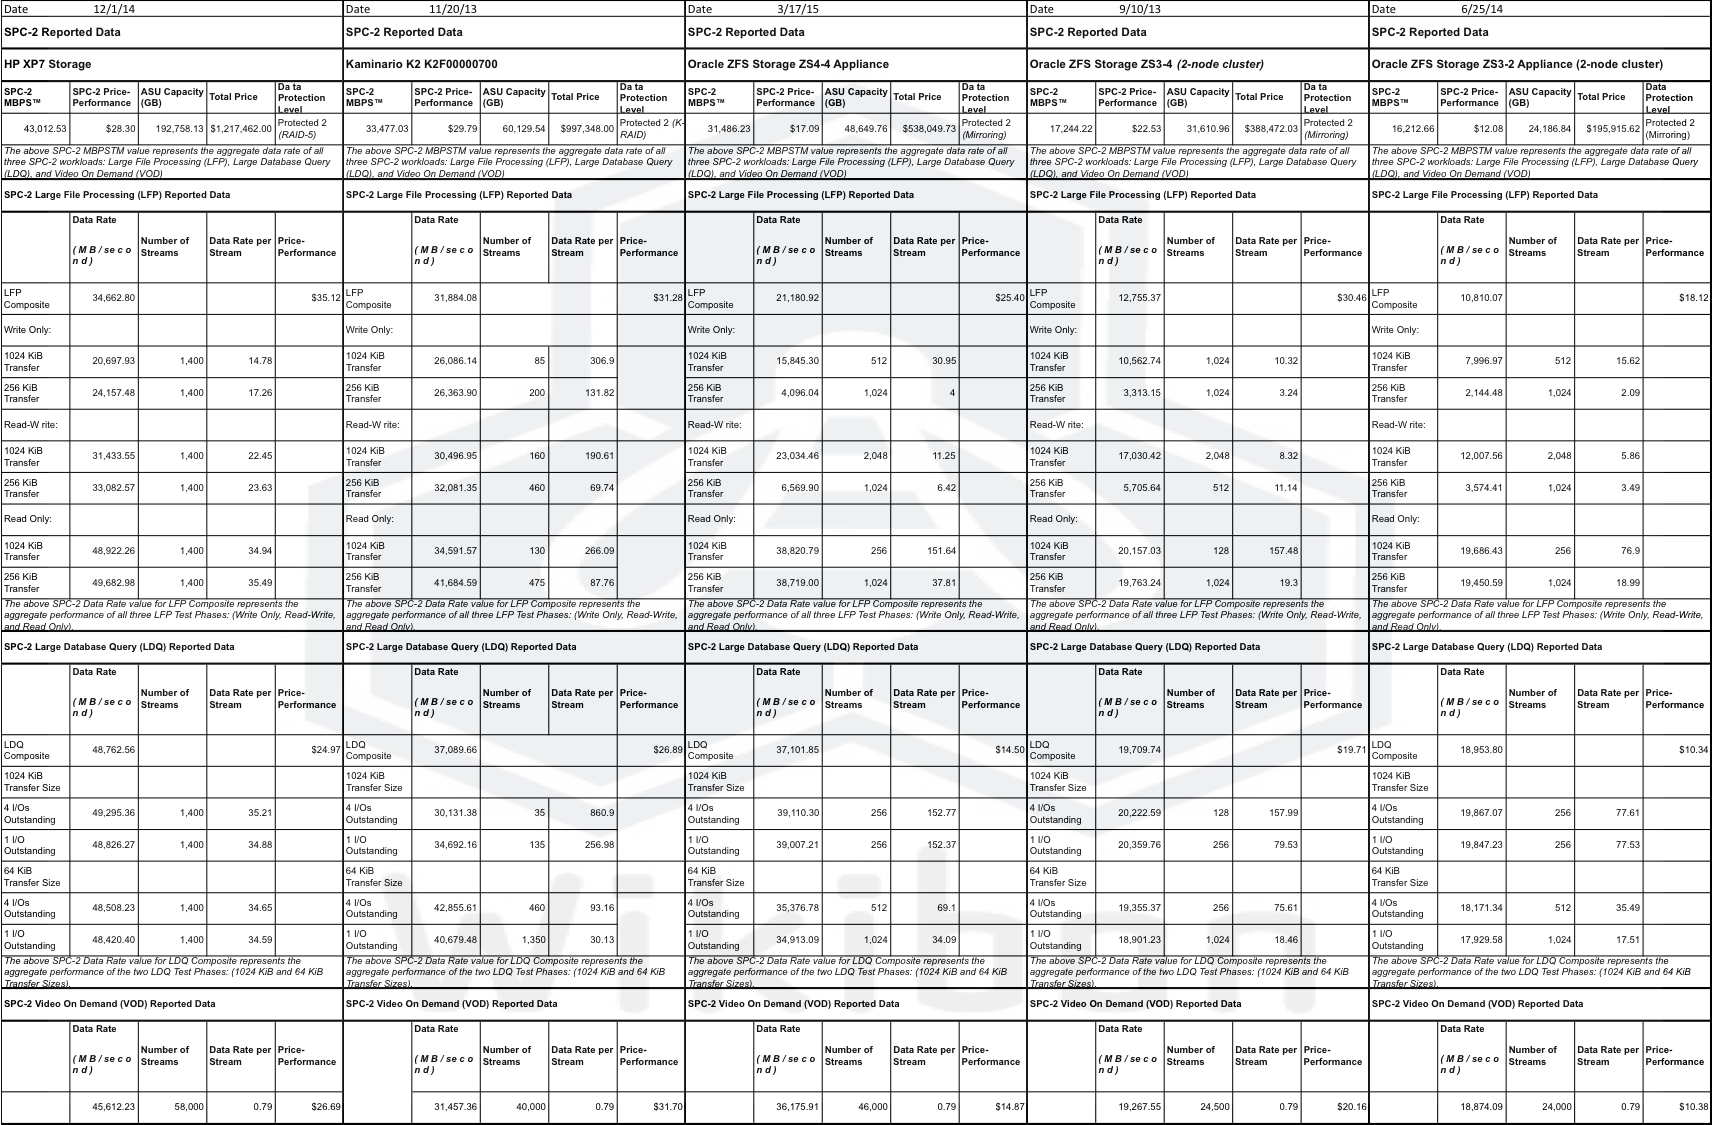
Source: SPC-2 benchmark results posted at http://www.storageperformance.org/results/benchmark_results_spc2_top-ten, down-loaded March 2015