Premise
Customers are asking how to choose from the rich and growing array of tools in the Hadoop ecosystem. Part of the consideration centers on how to insulate them from fragmentation in the continually evolving Hadoop ecosystem. The incredibly rapid pace of innovation distinguishes the ecosystem but it also has its downsides. The mix and match richness of choice introduces complexity for administrators and developers. And each vendor’s efforts to differentiate their distributions adds variation starting at the management tools at the edges and increasingly moving to the core analytic processes.
There is opportunity for third parties in the ecosystem to hide some of this complexity. The last section of this research report will take a look at one such example from Syncsort, which can simplify development and maintenance, and accelerate the application lifecycle.
Introduction
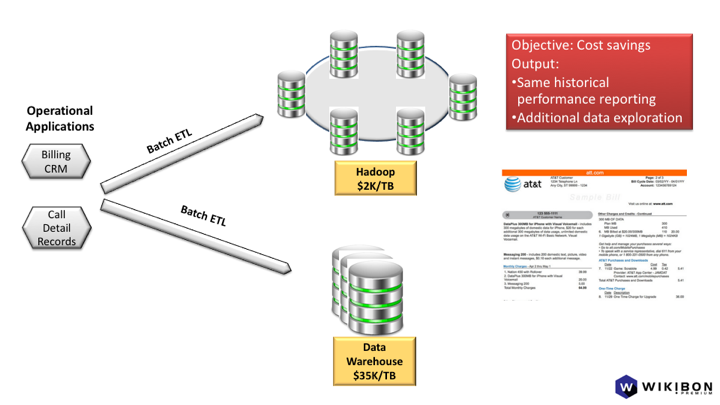
One of the most common use cases for Hadoop has been to augment the traditional data warehouse. Hadoop, which can cost as little as $2K/TB upfront, has supported offloading ETL processing from over-taxed data warehouses where capacity costs as much as $35K/TB upfront. Customers and tools vendors in the data warehouse ecosystem can cite running costs as high as $100,000+/TB/year, but we don’t have comparable running costs for Hadoop, so it is simply a standalone data point.
In addition to price/performance advantages, data scientists and business analysts can use Hadoop for exploring data volumes too large and unrefined for the data warehouse. Answers to questions that need to be operationalized can be deployed in production back on the data warehouse or on the Hadoop cluster. These use cases can show a strong payback for Hadoop.
These early use cases are good entry points because the demands on operational skills aren’t too great and the cost differential relative to data warehouses is substantial. Data warehouse offload can also establish the technical foundation and skills and deliver the budgetary savings for more transformative use cases. The greatest value comes from turning Hadoop into an analytic platform that helps remake legacy Systems of Record. Modern Systems of Intelligence require near real-time analytics. But they also require greater operational and development simplicity from a Hadoop-based foundation if they are to fulfill their potential.
Without that simplicity, there is the risk that complexity will constrain Hadoop’s growth as skills shortages and higher operating expenses offset its advantage in upfront cost.
This research report will explain how Hadoop’s data processing and management tools can be combined in a variety of ways to deliver on the use cases described above. The last section will cover one tool that can hide much of the complexity that comes from managing the data preparation pipeline.
We’re excluding proprietary, single-cloud solutions from Azure, AWS, and Google for the sake of scope. The option of having a single vendor design, build, integrate, test, deliver, and operate a coherent set of services has advantages and we will cover it as part of our ongoing research agenda. This is closely related to a scenario where a single, converged platform for analytics emerges, such as Databricks’ delivery of Spark-as-a-Service, whether as a complement or substitute for Hadoop.
Usage scenarios template
This research report is organized around customer usage scenarios first. It will show how there is a need for technology that can help insulate customers from the choice and change going on in the Hadoop and Big Data ecosystems. Each usage scenario will follow this template, which will show how the pieces fit together. In this context, fit means a high-level view of cluster topology, tools and engines, and data flow. (For the purpose of these usage scenarios, this description doesn’t go to the level of detail of a reference architecture, which would explain where processes belonging to each engine should be deployed).
Drivers
Topology: where the data comes from, how it’s processed, and where it goes
- Source
- Extract/Ingest
- Transform/Processing
- Target
- Load/Delivery
Tools: from the tools and runtimes outlined in question 3 at the beginning of the note
- Admin tools involved: ex. Ambari, Cloudera Manager, Ranger, Knox
- Runtimes/engines: ex MapReduce, Spark
- Development tools/libraries: ex MapReduce, Spark Streaming, Storm
Usage Scenario 1
How to use Hadoop to augment existing System of Record batch data warehouse analytics for exploring new data, operationalizing additional business intelligence, and offloading ETL processing from the data warehouse
Drivers
There is a great volume of data in operational applications that hasn’t been exposed in data warehouses that can be explored in Hadoop. Hadoop can be the target for all the raw, unrefined data that doesn’t belong in a highly-curated data warehouse. It can also offload much undifferentiated ETL processing that takes place in data warehouses. On both counts Hadoop has tremendous cost advantages.
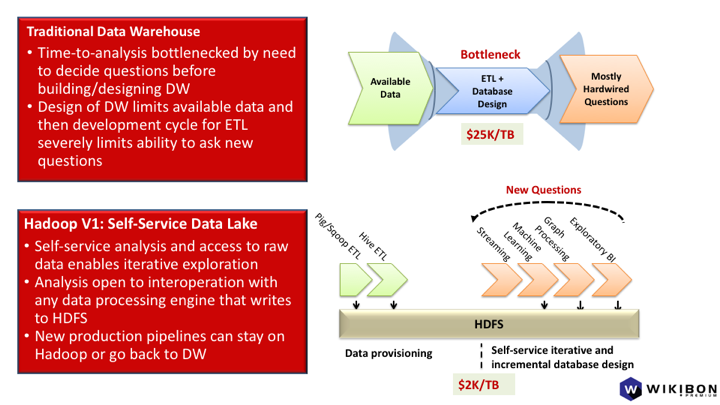
Data warehouse capacity can cost as much as $25-35,000/TB in capital expenditures for hardware and software. As much as 60% of the workloads are devoted to ETL processing. In other words, data warehouses are doing data preparation and refinement that isn’t directly supporting business analysts or production reports and dashboards. With data volumes growing far faster than Moore’s Law is bringing costs down, adding data warehouse capacity doesn’t work with flat IT budgets. With Hadoop clusters costing roughly $1,500-$2,500/TB, many of these workloads can migrate to the lower cost platform.
As Hadoop matures, even some of the production reporting can migrate from the data warehouse. Where the data warehouse is unique and unlikely to be challenged anytime soon is in combining support for strict SLA production windows with support for large user populations interactively working with data using pre-built views and OLAP cubes.
Exploratory data on Hadoop that is found to be useful when curated can be put in production either in the data warehouse or on a Hadoop cluster. Useful data can drive not only Business Intelligence, but also predictive models. For all the activities that start with exploratory data, a Hadoop cluster is the natural starting point. A data warehouse is the opposite. It starts with a design for a specific set of highly curated data and everything is designed from there. This scenario describes a common approach with Hadoop, and illustrates the complexity created by the extensive array of tools available for each step and role.
Topology
This usage scenario needs only one Hadoop cluster. The data comes from the same operational applications that feed the existing data warehouse.
Extract/Ingest processing
Sqoop, Kafka, Flume are among the most popular tools for extracting data from legacy applications for use within Hadoop. The data sources can be either batch or streaming.
Transformation and target
The workflows here can be broken down by the roles involved. Specialists trained for three types of roles representing three different types of value add are responsible for progressively refining the data. Each role has its own set of tools.
The overall workflow here involves extracting data from operational systems, loading it into Hadoop in raw form, finding meaningful data sets, and then creating views that traditional business analysts can consume. This last step is the one most familiar to data warehouse users. That is where familiar business intelligence tools turn views into OLAP cubes or prepare production reports and dashboards.
Data scientists
First, data scientists take the raw, non-curated data that’s landed in Hadoop from the extract and ingest step. Since legacy applications typically aren’t designed to generate well-structured external data feeds, all the sources typically have different ways of organizing their data. It’s the responsibility of data scientists to create context for this data.
Their tools are often labeled “data wrangling”, which come from vendors such as Tamr, Trifacta, Paxata, Tresata, and Alteryx. Data scientists have to refine this data just enough so that others can see how data sets from different operational apps can fit together. One way of thinking about this step is to picture a proxy for a “catalog”.
Those who refine the data further downstream can now see all the sources in one place. But the data isn’t ready to be combined and analyzed by someone unfamiliar with the source applications. At this point the data is in file formats such as Parquet and Avro. These formats lay out information about the data, but it’s not rich enough for traditional business intelligence tools to browse through it all very easily. Rather, at this point, the data is ready to be picked up by data engineers who fashion it into views in a formal data catalog that business analysts can consume.
But in some scenarios there’s another step that involves the data scientists. Their biggest value-add is when they work with the data to supervise machine learning. The resulting predictive models can be used to remake legacy Systems of Record into modern Systems of Intelligence. We’ll revisit this in the next usage scenario, when near real-time analytics, powered by predictive analytics, can help up-level legacy applications.
Data engineers
Data engineers are responsible for transforming useful data that the data scientists find into a production pipeline that continuously delivers that data. The pipeline can deliver the data refined into a formal catalog that business intelligence tools can browse on Hadoop. That’s the scenario where Hadoop is the platform for exploration. The pipeline can also run the refining process on Hadoop and deliver the refined data to the data warehouse. That’s the scenario where Hadoop offloads ETL processing from the expensive warehouse and transforms it into an ELT process.
Data engineers have a different set of tools, typically working directly in programming languages such as Python and Java. They take the “proxy data catalog” from the last step one level further, from data in Avro or Parquet formats into a real data catalog. The standard Hadoop catalog is HCatalog, which emerged from the Hive project.
They have to combine the data from the prior stage into views that seamlessly integrate the different source applications. If the sales order entry system has one way of tracking customer information and the CRM application has another, the data engineers have to create a single set of views that integrates the relevant data. The key word here is relevant. Ultimately, their value-add in the multi-step refining process is to ensure that business analysts, who work with business intelligence tools, can “consume” these views.
When developing the ETL pipeline offload process, the target MPP databases aren’t Hadoop-native. Rather, they include Vertica, Teradata, Netezza, DB2, Oracle, and, in the cloud, AWS Redshift or IBM’s dashDB, among others. Rather than doing the cleansing, enriching, and reformatting on the data warehouse, which is difficult and expensive to scale, those processes are offloaded to Hadoop. Their output, the highly curated data ready for exploratory BI and production reporting, then gets loaded into the data warehouse The data warehouse is designed to answer a specific set of questions and the ETL pipeline, now on Hadoop, is designed to source and refine just the data from the operational applications that can answer these questions.
Business analysts
By the time the refining process has reached this point, whether on Hadoop or the data warehouse, the views are structured so that they are optimized for a specific set of questions. It’s the business analysts who specified these questions, usually in well in advance of the whole process. They consume the views to create the OLAP cubes, visualizations, reports, and dashboards.
They use business intelligence tools such as Tableau, Qlik, Zoomdata, Microsoft Excel and Power BI, and Microstrategy. Some of these tools are only for their use looking at the data from different angles. Others are for repeatable, production deployments such as operational reports and dashboards that a wider audience uses to track how the business is performing. These client tools actually run against MPP SQL database servers, typically ones that have been designed to run as part of a Hadoop cluster. They include Hive, Impala, Drill, Presto, Spark SQL, and many others.
Sometimes the business analysts will uncover questions for which they don’t have the data to answer. At this point they have to communicate to the data engineers who themselves may have to go back to data scientists or even the source systems if new data is required.
Usage Scenario 2
How to add near real-time analytics to transform Systems of Record to Systems of Intelligence
Drivers
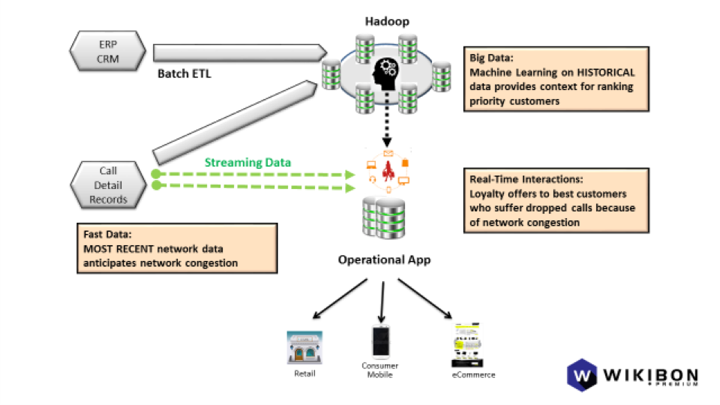
The example in this scenario is a mobile Communication Service Provider (CSP). The goal is to provide the best call completion service to the best customers and to make the most relevant loyalty offers to customers who experience dropped calls or who are exceeding their data allotments.
Traditional data warehouses work at arms-length from operational systems. Their purpose has been historical performance reporting. These traditional databases tightly integrate a set of analytic functionality anchored around SQL’s aggregation features. The most advanced ones have some statistical and machine learning functionality built-in. But what they gain in usability by virtue of integrated functionality, they lose in choice and extensibility.
Hadoop provides a new technology foundation for customers to analyze larger data sets, faster, and to mix and match analytic tools from rich ecosystem. The trade-off at its current state of maturity is significantly greater complexity of development and administration relative to traditional data warehouses. But for organizations with the skillset, or those able to access it as a fully managed service, Hadoop can augment existing operational Systems of Record and transform them into Systems of Intelligence.
Topology
As with the last usage scenario, one Hadoop cluster can support the workflow. But several different data flows are going on simultaneously. One flow deals with streaming ingest and analysis. The other deals with batch ingest and analysis.
Source
Source data comes from both operational apps and context from the current user in near real-time. The operational apps generate call detail records that record all the information about network performance for all calls as well as the billing data that gets added to each customer’s account. The context comes from the CRM app which manages channels and touch points that provide ambient intelligence in the form of observations about the customer’s interactions. These include data such as handset location and recent application activity.
Extract/ingest processing
Kafka has promise to become the default tool here, though there is some legacy use of Flume. For both batch and streaming processing, the metadata describing the dimension data, such as geography, product line, date, etc. must be separated from the data about the transactions themselves. This isn’t an obscure detail. Many customers encounter this because the feeds coming from operational applications don’t or can’t structure their output this way. Often the performance burden would interfere with their SLA’s.
Transform/processing
The data scientists in usage scenario #1 above would be using machine learning to come up with predictive models whose goal is to anticipate and influence the customer’s behavior. This would include determining which customers were most important when determining how to allocate connections dynamically when there is congestion at a cell tower. The data scientists would also model what loyalty offers would be most effective for the highest value customers who experience dropped calls or poor call quality.
Transform/batch processing
Data scientists would be running batch processes to generate these predictive models. The historical data about network performance, dropped calls, and customer affinity to loyalty offers would all factor into how to prioritize service and make the most effective loyalty offers.
Transform/streaming processing
The streaming data feeds the models so they can make predictions in near real-time. This process is called scoring. The application tracking network congestion might feed call detail records about how the network is performing for each customer connected to a cell tower. Based on this up-to-date data, the model could prioritize which calls are likely to be dropped.
Another application would feed another model information about customer loyalty in the form of lifetime value and the trends in their consumption of data and other services. Based on these factors, the customer loyalty model would predict which are going to be the most valuable. The operational application would call on the models both about loyalty and connection prioritization to rank which calls to drop and what type of loyalty offers to extend to the customers who were affected.
Processing engines
A growing school of thought believes both the batch and streaming processing can be the same engine. They could both run Spark Streaming, Flink, Samza, Data Torrent, the just announced Hortonworks Dataflow, or other stream processors that seem to be appearing almost monthly. The batch process would just require more nodes because of the greater volume of historical data and because it would feed a machine learning engine. The streaming nodes would be engineered for the lowest possible latency (fastest speed). They would feed the most recent data to the predictive model created by the machine learning engine. The scores coming out of the model would drive the application to prioritize connections and customize loyalty offers.
Target
The operational apps, whether the CRM app or the one managing the cellular network, would get their recommended actions from the scores generated by the predictive models. A message queue like Kafka would be an ideal transport to deliver “exactly once” reliability from the Hadoop cluster to the operational application.
Addressing the trade-off of rapid ecosystem innovation: complexity, fragmentation, and rapid evolution in the Hadoop ecosystem
Traditional data warehouses have had decades during which their ecosystems matured. Maturity means customers have tools which could hide complexity and platforms with sufficient stability that they don’t need future-proofing.
Reviewing the Hadoop usage scenarios above with all the choices for getting the job done illuminates the challenges that remain in its ecosystem. The downside of all the disruptive innovation is that a great many choices introduce fragmentation by solving a narrow part of the problem. They sometimes overlap, adding complexity. And the sheer pace of change creates a need for technologies that are future-proof.
Let’s review these challenges by breaking them down into two categories.
The first category shows the choice of data processing engines as well as the programming layers that make them more accessible.
The second category shows the even greater proliferation and fragmentation of tools for operations management, governance, and security.
What we should expect to see in the future after surveying this landscape is what all ecosystems experience as they come together into more coherent platforms. The individual pieces coalesce into higher level end-to-end platforms. That is beginning to happen within parts of the Hadoop ecosystem that address key usage scenarios which we described above.
Data processing engines and their higher-level programming layers
The diagram in Figure X shows how rapidly Hadoop data processing alternatives proliferated beyond the original MapReduce. The first version of Hive, for example, was created to provide a SQL interface to the low-level Java programming model of MapReduce. Other interfaces on MapReduce that appeared include Pig, Cascading, Crunch, Giraph, and Mahout.
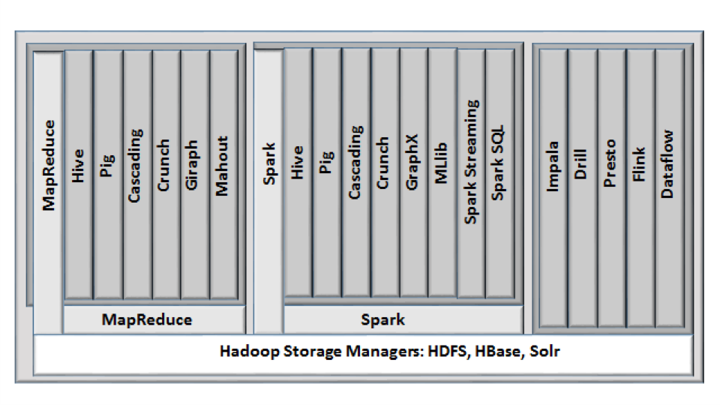
No sooner had customers, integrators, and ISV’s settled on MapReduce and these higher-level extensions than Spark came along as a faster, easier, and more robust replacement for MapReduce. While not fully complete, it is attracting many of MapReduce’s same high-level interfaces as well some new ones that work better on its foundation, including streaming and machine learning.
Besides the general purpose foundation data processing engines, some special purpose ones were created to deliver the optimal performance. Prominent ones here include the MPP SQL data access engines Impala, Drill, and Presto. But there are also a rapidly expanding set of dedicated stream processing engines such as Storm, Flink, Hortonworks Dataflow, Data Torrent, and Samza.
Future proofing
Today the mainstream compute engines are batch processes that might run Hive or Impala or another Hadoop MPP SQL DBMS. But the interest in near real-time streaming processing is growing at a phenomenal rate because it offers the promise of greatly accelerating analytic data pipelines. With new batch and stream processing engines are emerging all the time, having the option to take advantage of the most up-to-date functionality would have great value. As a result, there is an acute need for a technology that can future-proof both batch and streaming in general as well as specific implementations.
Tools for operations management, governance, and security
The administrative tools are different from the data processing engines because the administrative tools typically manage elements of the end-to-end process. In other words, while the data processing engines may do the work that ultimately gets delivered, it’s the administrative tools that make sure the job gets done.
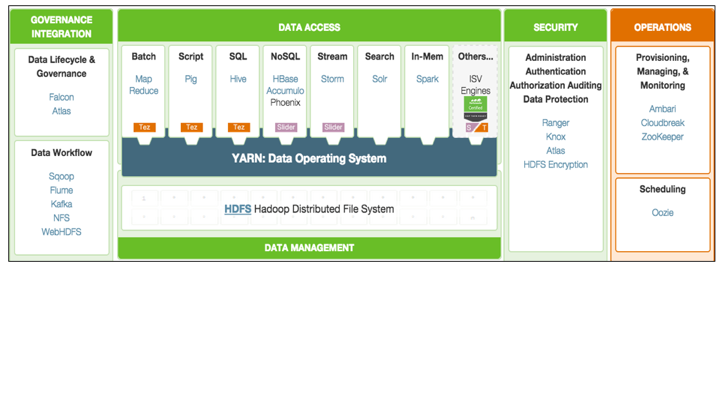
Hortonworks, MapR, and Cloudera have each taken very different approaches to administrative tools. Hortonworks has focused on embracing the rapid innovation in the Hadoop ecosystem as well as buying and contributing to the ecosystem new tools that fill in gaps. The trade-off of adhering most closely to the ethos of the open Hadoop ecosystem is the complexity and fragmentation that exists while the platform matures.
MapR, by contrast, built its platform on proprietary but API-compatible, production-ready HDFS and HBase database foundations that made many of the admin tools provided by its competitors unnecessary. The trade-off of this approach is the potential for the open source versions of HDFS and HBase to move in a different direction.
Cloudera has chosen to differentiate its offering by developing a proprietary set of administration tools named Cloudera Manager that can deploy, configure, operate, monitor, and diagnose a cluster. Its approach trades the rapid and open innovation of the Hadoop ecosystem for greater end-to-end integration and coherence.
Syncsort’s DMX-h as one approach to addressing complexity, fragmentation, and rapid evolution in the Hadoop ecosystem
In the absence of an integrated, high-level platform, there is a strong need for a tool that can simplify the management of as much of an end-to-end usage scenario as possible. In addition, given the unprecedented pace of innovation in the Hadoop ecosystem, a tool that provides future-proofing by insulating customers from changes in underlying technologies would also have value.
Big data is not new to Syncsort, which has been a significant presence with its high performance Sort products both on the mainframes and distributed systems for many decades. As platforms have changed, so has Syncsort evolved their technologies.
Their high-performance data integration software for Hadoop, DMX-h, helps users accelerate adoption by eliminating the need for custom manual coding (with SQL or Java, Pig, HiveQL, etc) and allowing them to leverage existing skill sets. Like their mainframe and UNIX products, DMX-h was designed to be performant and efficient.
Most recently, Syncsort has developed an intelligent execution capability to plan and optimize for the underlying compute framework, without exposing the complexity of the underlying compute paradigm.
That means it can leverage and optimize for the unique functionality of each of the underlying engines rather than just the lowest-common denominator. Optimizing for the unique functionality of the different processing engines would be like having a SQL query engine that can access data from Microsoft SQL Server and Oracle 12c using the unique features belonging to each.
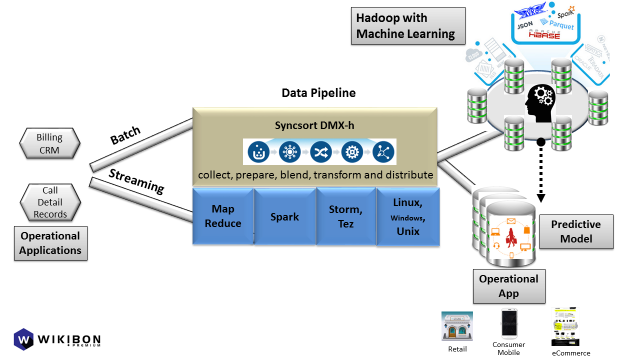
Figure 6: Example of a tool that abstracts the collection, preparation, blending, transformation, and distribution of data from operational applications to Hadoop for batch analytics such as machine learning and user-facing operational applications in order to influence user interactions.
And in mapping to these two foundation data processing engines, DMX-h can do the same work as the higher-level interfaces that work with these engines, such as Hive or Pig. But it exposes its functionality to developers within a GUI tool, not a SQL access layer or a scripting language.
Understanding where DMX-h and SILQ fit by looking at how it works within the above usage scenarios
Syncsort DMX-h is designed to simplify and optimize the use cases described above by providing a single data pipeline that can run on any of the compute engines on-premise or in the cloud. The user shouldn’t have to understand or even pick the best underlying technology. Syncsort takes care of that under the covers.
When MapReduce v2 came out, customers who wrote directly to the v1 API had to migrate their applications. Syncsort jobs and tasks were never exposed to that. In order to visualize how this works, refer to Figure 6 above. DMX-h sits on MapReduce and will have a technology preview on Spark by the end of the year. It sits alongside the abstraction engines that simplify and specialize them, including Hive, Pig, Cascading, and Mahout, among others. Taking Pig as an example, a developer using it is writing code that will itself generate the Java Map and Reduce steps that drive the underlying MapReduce. Unlike the scripting language in Pig, DMX-h lets the developer specify the process in its GUI tool. That delivers obvious developer productivity benefits and eliminates the need to maintain code in the future.
When we drop into the ETL and business intelligence usage scenario described above, we see more of the opportunities for DMX-h to simplify the process. For example, ingestion, preparation, blending, transformation and distribution are often seen as separate processes. However, with DMX-h, these happen in a single step, which not only simplifies the data flow, but also optimizes it.
For the ingest step, DMX-h can take the data directly from the sources and stream directly to the data nodes, without landing to edge node storage, writing directly into native Avro and Parquet and other Hadoop-supported file formats. The data scientists do not need to spend their time on writing custom code specific to each of the data sources they need to explore. This is handled by Syncsort DMX –h through a graphical user interface where one can drag and drop data sources, sample the data and map to the metadata whether the data is originating from a relational DB, tweets in JSON, mainframe binary file or messages from Kafka. Furthermore, for offloading SQL to Hadoop, Syncsort provides a tool called “SILQ” that helps generate a fully documented flow chart of complex SQL and automatically generates jobs to run natively in Hadoop using DMX-h.
The preparation step typically takes data ingested into HDFS, and sorts, cleanses, partitions, compresses and translates it, using a choice of tools such as Pig, Hive, and raw Java and Python. With DMX-h, developers can use the GUI to define data preparation tasks during ingestion, which are executed by the high performance DMX-h engine on the fly, before loading into Hadoop. This not only simplifies the process by eliminating staging steps, but results in lower latency. Moreover, all of the processing runs natively within the Hadoop data flow due to Syncsort’s ongoing contributions to Apache Hadoop and Spark projects.
The blend step takes multiple sources of data within Hadoop and joins them into something more meaningful. For example, customer master data might be joined with sales data so that a business analyst further down the line can easily analyze sales by customer without having to do any joins herself. Today this blending and enrichment might also be done directly in Java or Python or with the higher level tools such as Pig, Hive, or Impala. Again, the GUI DMX-h tool can simplify this task as part of a larger process. And, it should be noted that, due to Syncsort’s mainframe heritage, their DMX-h tool is unique in its ability to access, understand and process complex mainframe data as well as other structured and unstructured data sources.
The transform step is the core task in the ETL process. This is where data gets turned into views suitable for reports, OLAP cubes, or dashboards. Natural tools that would do this step include MapReduce, Spark, Hive, Impala, Drill, Presto, and others. But as the ecosystem and tools evolve, major design and code changes are required by developers to adopt new technologies. Syncsort DMX-h allows users to design data transformations independent of the underlying platform or execution framework. Developers can visually design data transformations and DMX-h picks the best algorithms and execution path to execute the job at hand without requiring application changes or tuning.
Near real-time analytics: Most of these steps would be in the second usage scenario as well, where continuous refinement and analysis of streaming data takes place. The stream processing engines mentioned in the ingest step above are not just for ingest, but the entire analytic pipeline. But they still need joining, filtering, and aggregation. The analytics can vary greatly by product. But DMX-h will be able to put an abstraction layer on them so that it drives the joining, filtering and aggregation.
Conclusion
Hadoop is one of the most innovative ecosystems the industry has ever seen. But fragmentation and complexity are the trade-offs of all this rapid evolution while the platform is still maturing. Choice has a cost.
This research report has only examined the compute engines that process data. But the fragmentation in management, governance, and security tools is just as great. There is a continually expanding array of tools such as Oozie, Falcon, Atlas, Knox, Ranger, HDFS DARE, Ambari, Hue, Sentry, Sahara, Cloudera Manager and Navigator, and Zookeeper.
At some point it makes sense for customers to consider investing in a tool that can hide much of that complexity. To be clear, there is no magic product that can hide all these technologies. But when customers take the perspective of simplifying an end-to-end process, solutions are available to address the problem.