Premise
The adoption of flash storage in the enterprise is propelled by two unassailable trends: consumer volume economics and enterprise data value benefits. While the history of enterprise flash storage is relatively short, its future is long. Flash storage is more expensive per bit. However, the higher performance of flash means than much less physical flash storage is needed for most enterprise applications to achieve the same logical storage (as seen by applications and the end-user). Wikibon projects that enterprise flash logical capacity (the effective capacity as seen by end-users) will reach 50% of total logical enterprise capacity in 2021. In terms of enterprise system storage spend (enterprise hardware and software), Wikibon projects the amount spent on enterprise flash will equal that spend on enterprise hard disk in 2019.
Even more important, Flash is poised to disrupt the scope and power of applications, and deliver game-changing improvements in application value and business automation (see Flash Technology Roadmap below).
Our robust outlook for flash was challenged by Infinidat CEO, Moshe Yanai in a visit to Wikibon offices. It led us to do further research, not only with array vendors like Infinidat, but also with drive suppliers such as Seagate and WD as well as component suppliers and specialized market researchers like TRENDFOCUS. While we remain bullish on the outlook for flash, our research indicates that the life span of capacity-oriented enterprise HDD will be longer than we had initially anticipated.
As a result of the discussions with Infinidat and other members of the ecosystem we believe that certain array suppliers that can leverage spinning disk could have a near-to-mid-term cost advantage – particularly as component shortages create upward pricing pressure on NAND flash.
Introduction
Magnetic storage devices have been a fundamental data center technology for over half a century – beginning with the IBM RAMAC of 1957 all the way to the 10TB drives of 2016. Manufacturers such as Seagate, Toshiba and Western Digital have relentlessly improved performance, density and reliability over this time, ensuring that magnetic technologies will continue to be used in volume for enterprise storage though 2026.
In comparison, flash storage technology is a relative newcomer, driven by the consumer market for the past decade. Flash in the enterprise data center market is an even more recent development, but has been penetrating rapidly.
Trends in Storage Technology
Flash Technology
Source: © Wikibon 2016
See Table 1 in Footnote2 for assumptions.
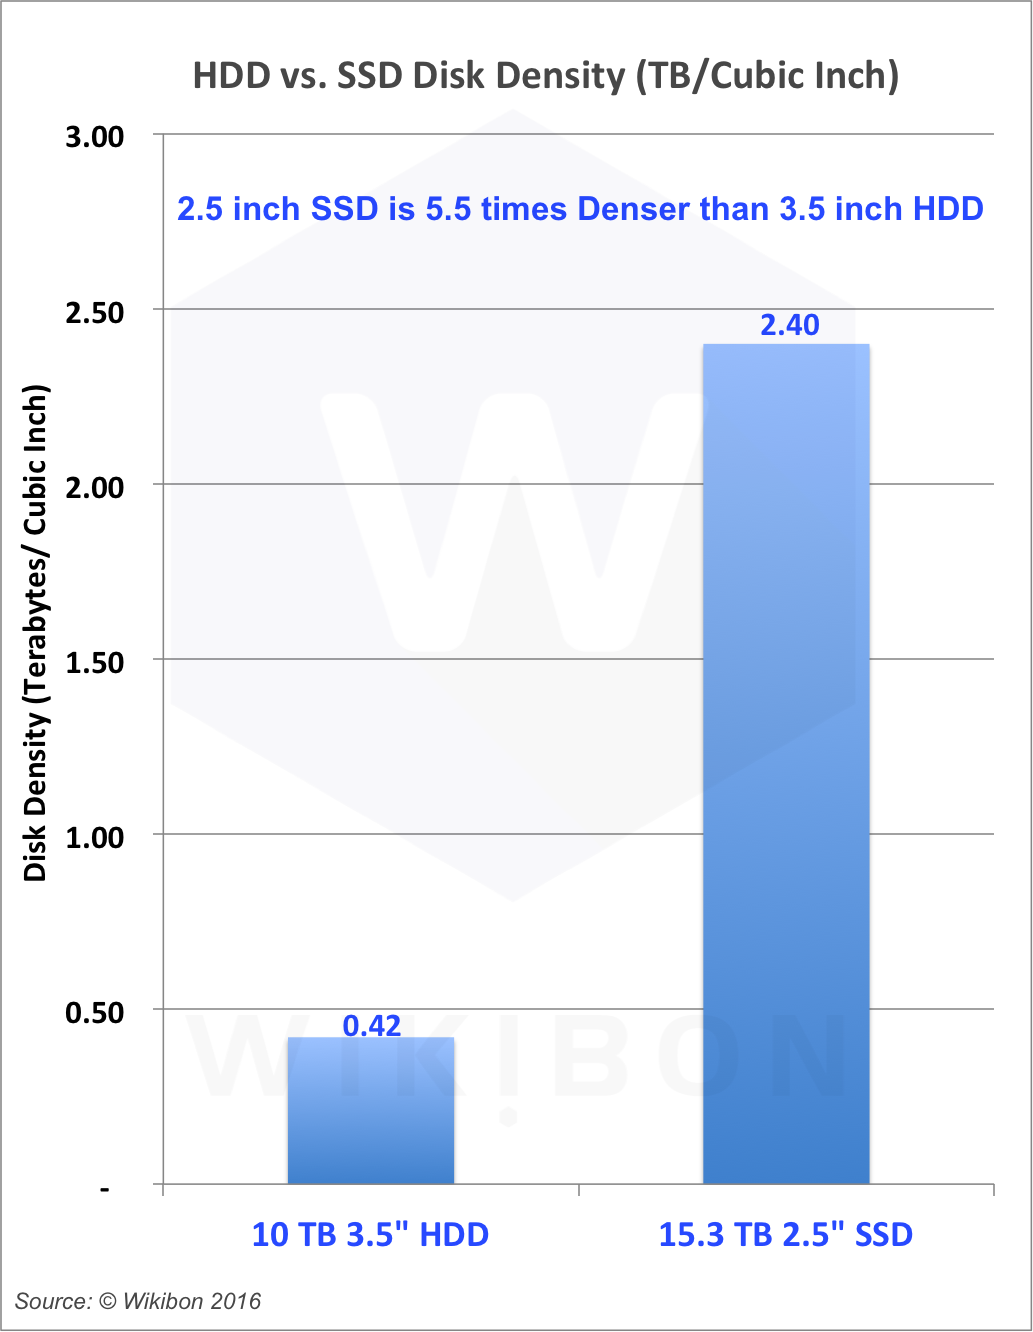
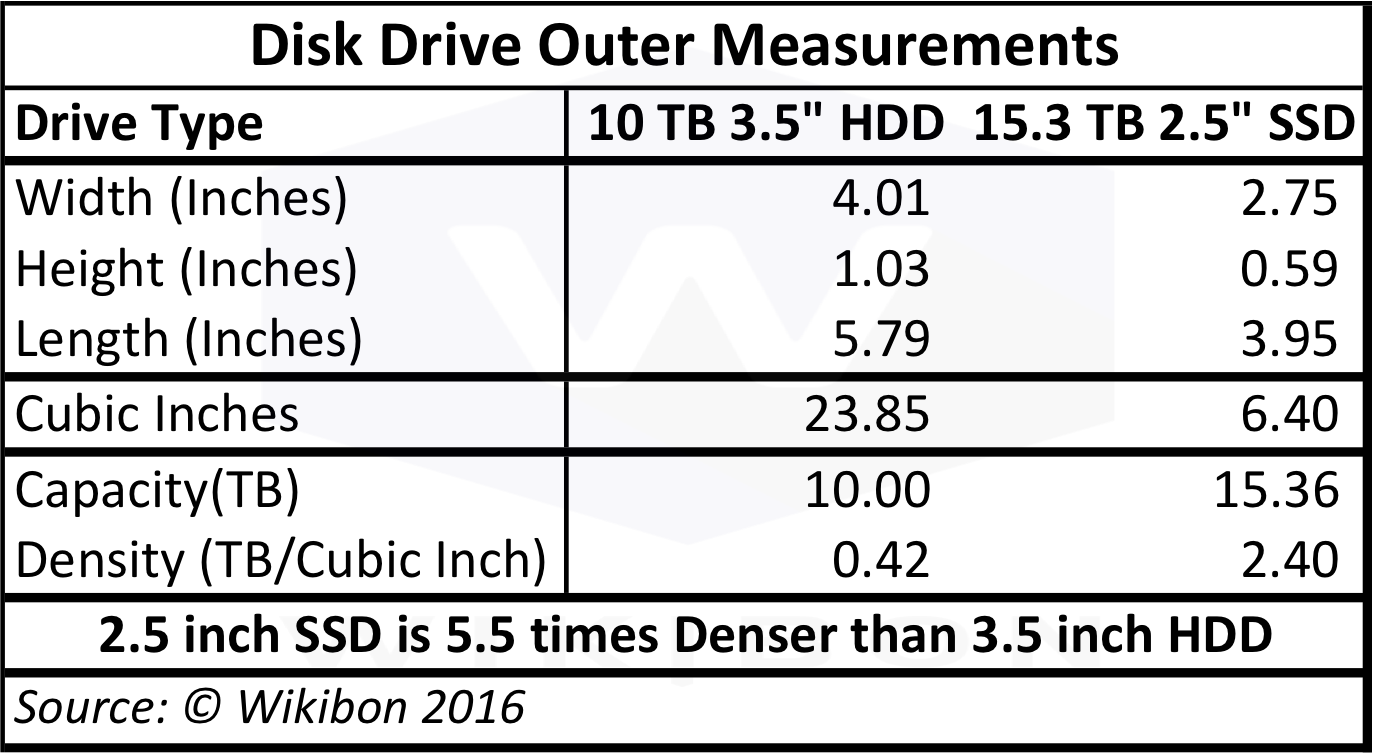
Wikibon has written early and often about Flash in the data center starting in 2008 with the first announcement by EMC of Enterprise Grade flash disk 3.5″ drives (73 GB & 146 GB capacity). Eight years later NetApp has just announced the shipment of 15.3 Terabyte 2.5″ drives in 2016. This represents an annual CAGR in flash density/drive of 79%. For the first time in 2016, the capacity of a flash drive exceeds that of the densest magnetic hard drive (10TB). On top of that, the cubic density the 2.5″ 15.3 terabyte SSD is 5.5 time higher that the 3.5 HDD, as shown in Figure 1.
When any new disruptive technology is adopted, the usage envisioned by its developers is rarely the same as the actual usage by the buyers. Flash storage is no exception. In enterprise traditional datacenter computing, the major differences between flash drives and magnetic drives is the higher price of flash drives, and the higher bandwidth and IOPS that can be driven by Flash technology.
The earliest use of flash was for high value systems, where the cost of flash could be offset by requiring less server capacity and fewer software licenses. Recently, users have found that by using technologies such as snapshots, they can provide multiple simultaneous logical copies of data to different people and applications, enabling sufficient bandwidth and IOPS for all to to access the single physical copy simultaneously. For example, 30 developers can be given a logical copy of the production system and databases at the same time as QA receives it. These developers can use and reuse these copies at the same time, storing only the changes.
Wikibon’s research shows that enabling faster time to data, providing faster response times and eliminating differences between QA and developer testing environments leads to average increases in programmer productivity of over 100%, and reduces time-to-value by 50%. This sharing of data takes time to implement, because it requires a change to the existing data promulgation procedures, but when implemented can have a profound effect on lowering the cost of flash storage and increasing benefit of IT to the business.
Hyperscale
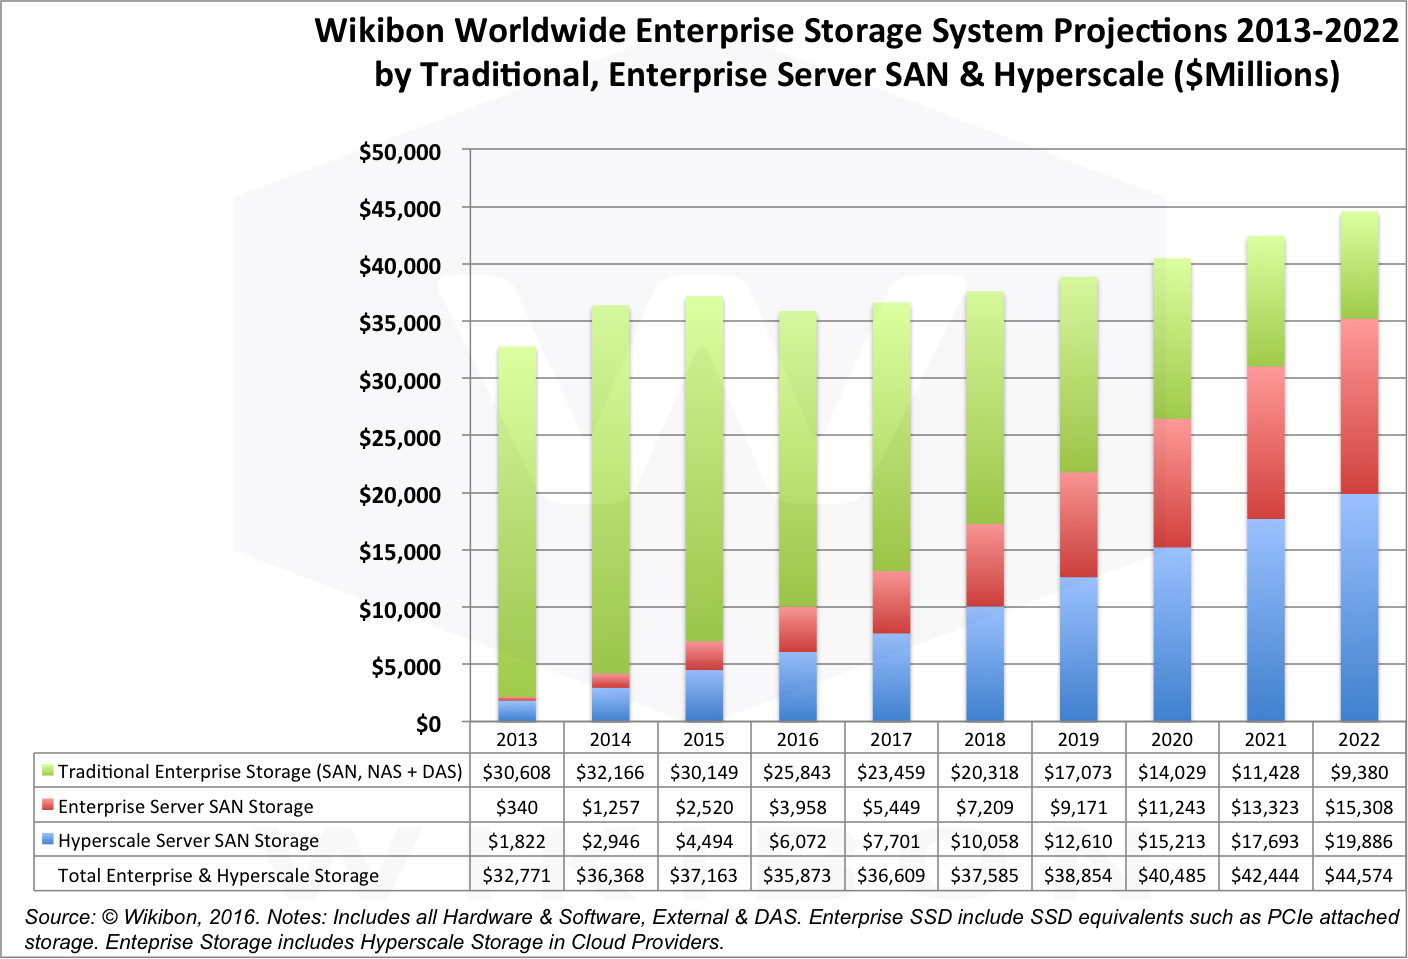
An important impact on the storage market is the growing amount of Hyperscale storage deployed in clouds. Figure 2 below shows the Wikibon worldwide enterprise storage projections from 2013 to 2022. The overall market is growing from $33 billion in 2013 to a projected $45 billion in 2022. Within that growth, the traditional enterprise storage market (external SAN & DAS, and directly attached storage drives) is projected to shrink, and be taken over by Server SAN storage, where the drives (both HDD and SSD) are directly attached to a server. This reduces cost, and enables faster access to storage. The enterprise Server SAN storage will have a similar applications and workflow to traditional storage.
However, the hyperscale Server SAN is used for cloud storage, with different storage software, different applications and different workflows. The storage software is often written by the cloud providers to optimize to specific storage types. The applications are larger, and are often with large sequential datasets. Figure 2 shows that hyperscale is projected to grow from 17% in 2016 to 45% by 2022.
Cloud storage is in general less active than datacenter storage, and is more sensitive to the additional cost of flash storage. Wikibon projects that the flash adoption will be at a slower rate than the datacenter, with about 75% of the penetration of flash in the enterprise datacenter.
Some optimistic telecommunication companies and cloud providers have postulated that all consumer data and edge data (e.g., from the Internet of Things (IoT)), will all end up in the cloud. Wikibon’s research shows that in the case of IoT, a high percentage (95%) will stay at the edge, because of the cost of data transfer and for other compliance and business risk reasons. Bad news for cloud and telecommunications companies, but good news for enterprise IT budgets.
Source: © Wikibon 2016. See Table 2 in Footnote3 for General Assumptions.
Consumer
The adoption of flash in the consumer market is characterized by rapid adoption driven by improvements in performance, storage density, battery life and reliability. For example, in 2006 all Apple iPods used 1″ hard disk drives. That same year, the iPod nano was introduced using flash technology, and eight years later the classic HDD iPod was withdrawn from the market place. The smartphone market is 100% flash, and the same is now true of photography. PCs are rapidly adopting flash, and penetration is expected to reach 50% by 2016, even as the volume of PCs declines. Wikibon sees that flash storage will be a key marketing focus for all consumer devices requiring storage, allowing products to be smaller, much better performance, mobile, lower power consumption, longer battery life and higher reliability.
The magnetic drives are struggling to compete in the consumer space. Small capacity magnetic drives are expensive to manufacture, and entry consumer devices are now designed around flash drives, and defining the form factor for the whole device range. Wikibon is projecting a rapid decline in consumer HDD volumes, which will affect HDD in the enterprise .
HDD in the Enterprise
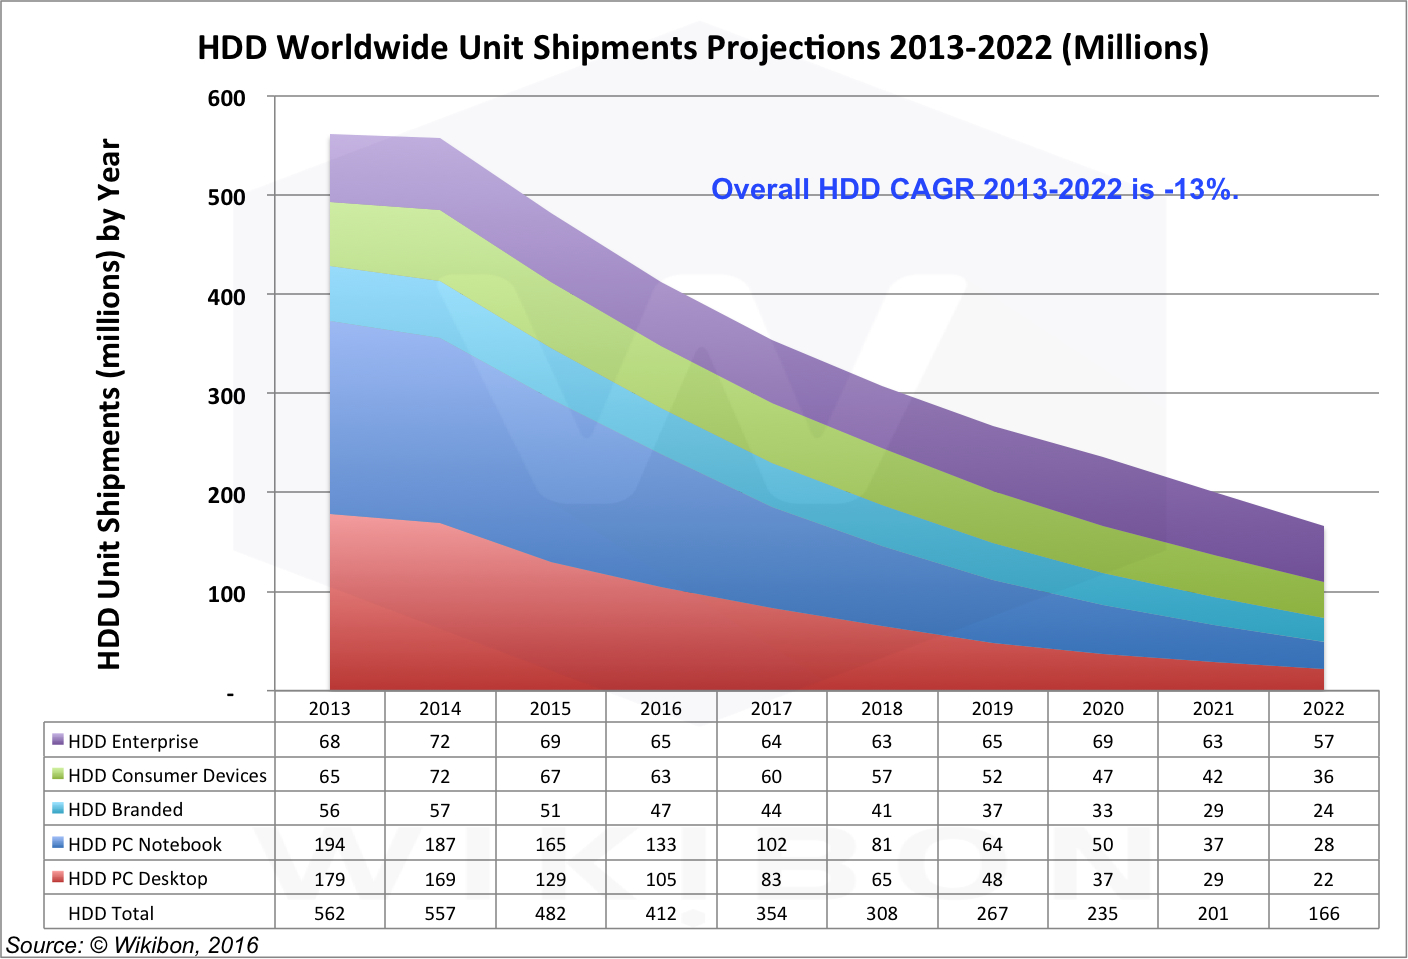
Figure 3 shows magnetic drive shipments (in millions of units) from 2013 to 2015 (actuals) and 2016 to 2022 (projected), declining by 13% annually. However, the percentage of HDD units shipped to enterprise data centers will be growing, accounting for 16% of HDD units in 2016 to an estimated 29% in 2020. By 2022 Wikibon expects that enterprise storage will account for 34% of HDD units. The capacity of the enterprise HDD drives will also be much higher, as the 15,000rpm performance drives are phased out and the Nearline drives increase in capacity/drive. Wikibon projects that the average capacity of an enterprise HDD drive will be about 9TB in 2020. As a result, Wikibon expects that data centers will account for about 40% of HDD OEM revenue by 2020.
Wikibon projects that HDD will continue to be an important component of data center storage going forward. Wikibon projects that enterprise storage will become the main revenue and profit center for HDD drive manufacturers, as consumer volumes decline.
Source: © Wikibon 2016. See Table 2 in Footnote3 for General Assumptions.
Flash in the Enterprise: Dramatic Growth
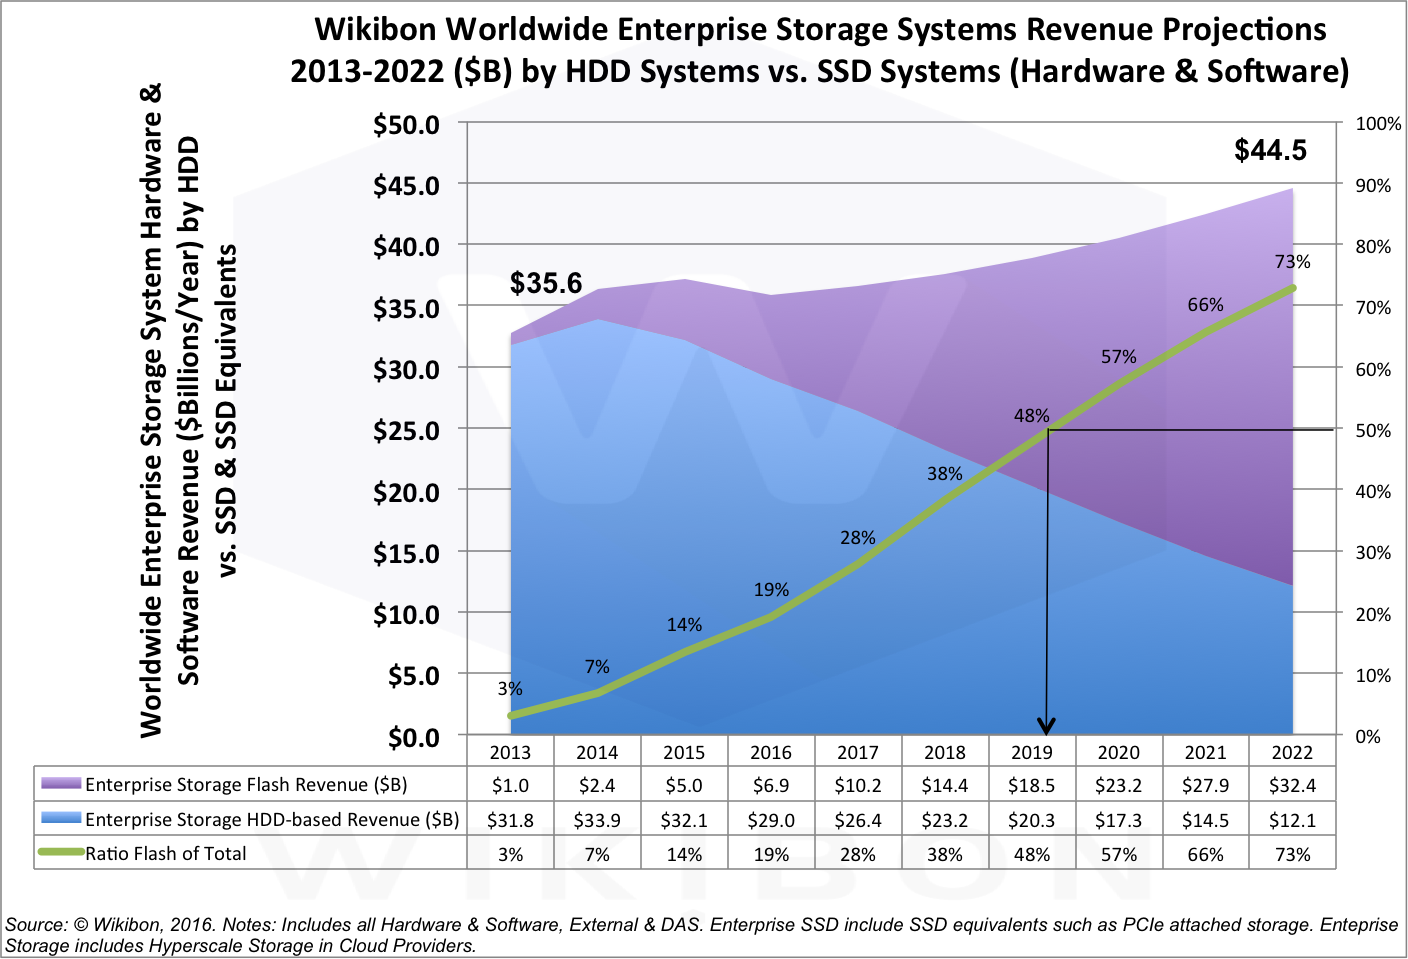
Figure 4 illustrates Enterprise Storage Revenue from 2013 to 2022. The revenue figures are for the total cost of storage, including drives, drive shelves, cabling, storage controllers and basic software. This includes higher cost storage arrays, directly attached drives (DAS) and cloud storage purchases by cloud providers. Overall the spend on enterprise storage is growing by about 3%/year (mainly because of the greater utility of flash storage).
Figure 4 reflects the fact that the more expensive performance storage is rapidly moving to flash, and increasingly HDDs are part of tier 3 storage, backup and archiving. In the cloud, low cost and low performance object storage services like AWS’s S3 run on hyperscale systems with low-cost directly attached HDD storage (the hyperscale topologies discussed above). Both EMC, HPE and NetApp are now actively selling the flash-only data center, as well as the flash startups such as Kaminario, Pure Storage, SolidFire, Tintrí and many others.
Source: © Wikibon 2016. See Table 2 in Footnote3 for General Assumptions.
HDD and Flash Technology Roadmaps
Flash Technology Roadmap
The reduction in cost (in $/GB) for consumer flash has been over 30%/year for the last five years. Wikibon projected that this rate will reduce to about 25% after 2019 and 23% by 2022. Enterprise flash currently has about a 5x multiplier in cost per unit of capacity compared with consumer flash. Wikibon projects this will come down to about 3x as the enterprise flash market matures and volumes increase. Wikibon projects the overall cost reduction in enterprise flash costs from the two factors of consumer flash price reduction and enterprise multiplier reduction will to reduce overall enterprise flash prices by about 30% over the forecast period.
The primary driver for Wikibon’s level of confidence in future flash improvement is the consumer market, which is demanding ever higher quantities of data in cell phones, tablets, PCs, cars, home entertainment, cameras, play stations and the myriad of consumer electronic devices. The volume of flash delivered to the consumer market is many times larger than the volume delivered to the enterprise data center market, and is the primary driver for fundamental research and innovation.
There is about an 12-18 month lag between new flash technologies hitting the consumer market, and their being transferred in volume to the enterprise market. Enterprise customers demand higher degrees of testing, higher availability and software support to be in place. New enterprise products are tested in less critical applications before being adopted at scale.
The greatest constraint to releasing the potential of flash is software. The flash software stack has been rewritten with NVMe protocols, and NVMf (f is for fabric) protocols are in progress for clustered Server SAN systems.
However, the biggest hurdle to flash adoption and exploitation is the middleware and the applications. Some middleware is being updated (e.g., Micrsoft SQL Server 2016 has advanced flash and storage as memory exploitation). Upgraded and future applications will be able to process 10 to 100 times more data in a single unit of time, exploiting large DRAM memories, larger DRAM/Flash persistent memories and very fast flash devices. Future applications will be able to process both advanced transactional data and significant analytic processing in the same unit of time. Wikibon projects that future applications will make business processes much more efficient, and will lead to significant automation. However, the lag between technology availability and application exploitation is 2-4 years. The additional application value that can be generated by new datacenter design around very close distances between processor, GPUs, persistent memory and low-latency smart storage, interconnected by very high-speed protocols such as RoCE (RDMA over Converged Ethernet) is the ultimate game changer, and will define winners and losers for the next decade. Wikibon projects that this will start being seen in the marketplace in 2019, and having an impact by 2021. Wikibon projects that enterprises that are not fully engaged by 2020 will not be able to recover, so great the economic and business disadvantage for enterprises not participating.
HDD Technology Roadmap
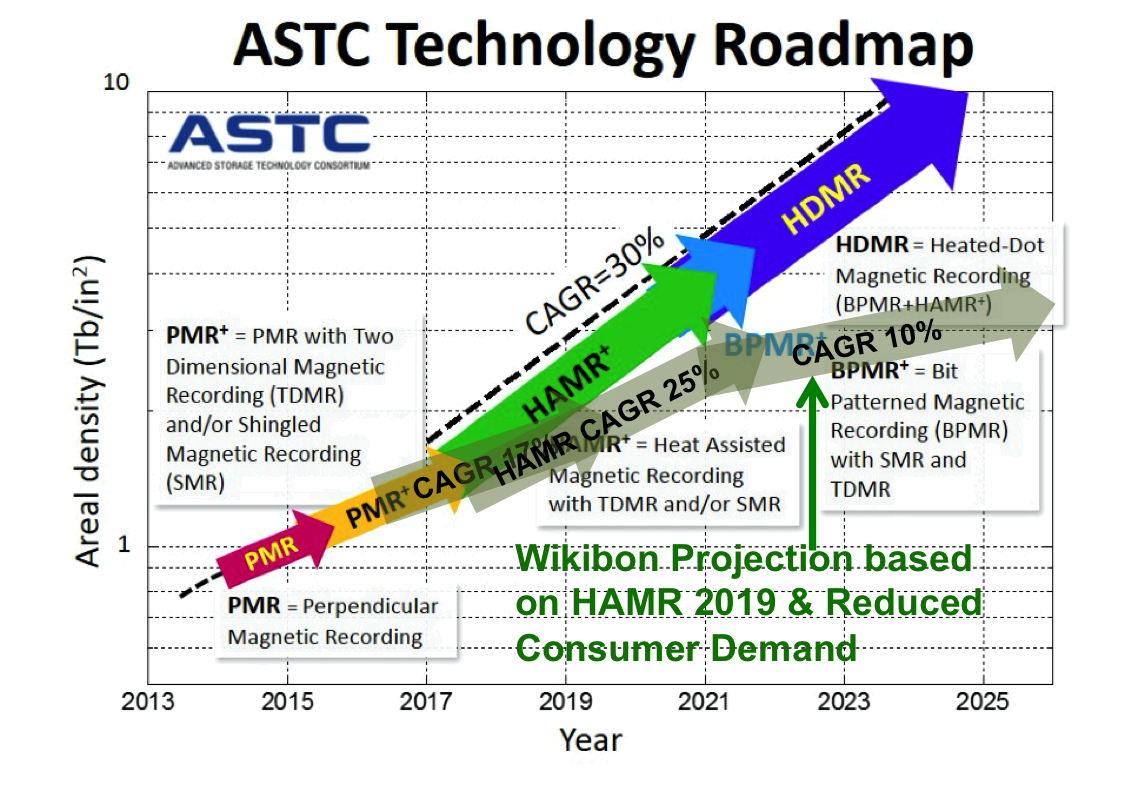
In comparison, HDD technologies have historically shown about 17%/year improvement in the areal density of storage, and an improvement of less than 10%/year in the bandwidth from HDD devices. These constraints have led to increasing challenges for accessing data on HDDs, and for storage vendors to find ways to hide the reduced access density of HDDs.
In the traditional enterprise world, today’s 10 TB HDD drives take days to empty or fill or restore, analogous to filling or emptying a gallon pail through a thin straw. Magnetic storage management is complex, and requires skilled people and sophisticated software to manage performance and recovery.
Hyperscale developers have utilized more advanced stacks specific to their application needs, such as advanced erasure encoding. They have also the resources to exploit new types of hard drives with higher densities from technologies such as shingling.
However, there are two technology issues that are difficult to overcome with magnetic technologies.
- The first is access density – it is becoming harder and harder to utilize all the data on a magnetic disk, if the data has at any time to be accessed, especially randomly. Access density is limited by physics, the speed of rotation of the drive, and is proportional to the square root of areal density.
- The second is called the “long tail” effect. Because of the mechanical nature of disk drives, occasional very long access times will happen rarely, but cause severe impacts on throughput and/or response time for the application. This is very expensive to overcome. Vendors such as DDN have overcome this by inline error detection and correction of 10 disks in parallel, but this become very expensive when hundreds of disks are in parallel. In reality, it is much cheaper to move workloads with “long tail” issues to flash.
Figure 5 below shows the Advanced Storage Technology Consortium (ASTC) magnetic disk roadmap with estimates of reaching 100TB HDD drives by 2025. Wikibon believes this projection is based on the expectation of high, continuing levels of HDD unit volume from the consumer market, and does not take into account the ability to share data in the enterprise. Wikibon’s projection in Figure 3 above shows the projected decrease in consumer HDD volumes that will not sustain the investments required to achieve the ASTC aspirations in Figure 5. Wikibon believes that the current trend of 17% annual growth in areal density will be the maximum possible for the next few years, and the technology will be driven by enterprise requirements. Wikibon believes that the HAMR technology (already six years in development) will take another 2-3 years to bring to market, and will be the last magnetic disk technology to be developed. As the overall HDD volumes decrease it will become harder and harder to justify investment in HDD technology improvements, and Wikibon believes that there will be rapidly decreasing investment in new HDD technologies after 2020. Wikibon projects the annual growth in areal density will decline to 5% by 2025, as shown in Figure 5. This is much less than the rate of NAND flash improvement, which is driven primarily by voracious consumer demand for products that are smaller, much better performance, mobile, lower power consumption, longer battery life and higher reliability. As HDD consumer volumes decline over time, so the rate of improvement in HDD areal density will also decline.
Wikibon believes that radically new applications discussed in Flash Technology Roadmap above will mandate flash technologies for both production and recovery systems. The business value of applications that can run on HDD drives will continue decline, and the TAM for HDD drives will continue to decline. The decline, like most technology transfers, will not lead to the elimination of magnetic disks, but just a smaller TAM and lower importance to enterprise IT.
Source: © Wikibon 2016, and ASTC (downloaded from http://www.enterprisetech.com/2014/12/05/storage-roadmap-sees-100-tb-drives-25/ 2015)
Data Reduction and Data Sharing
In the discussion of storage trends above, an example was given on the sharing of data by 30 developers and QA. In today’s HDD-centric data centers, most data is copied from disk to disk, and the cycle time between data creation/ingestion and propagation throughout an enterprise is measured in weeks. Wikibon and other research has shown that there may be 15-20 copies of data with an enterprise data center. Flash storage has sufficient performance to be able to sustain data reduction and data sharing. This enables more logical data to be stored on a physical bit of flash storage.
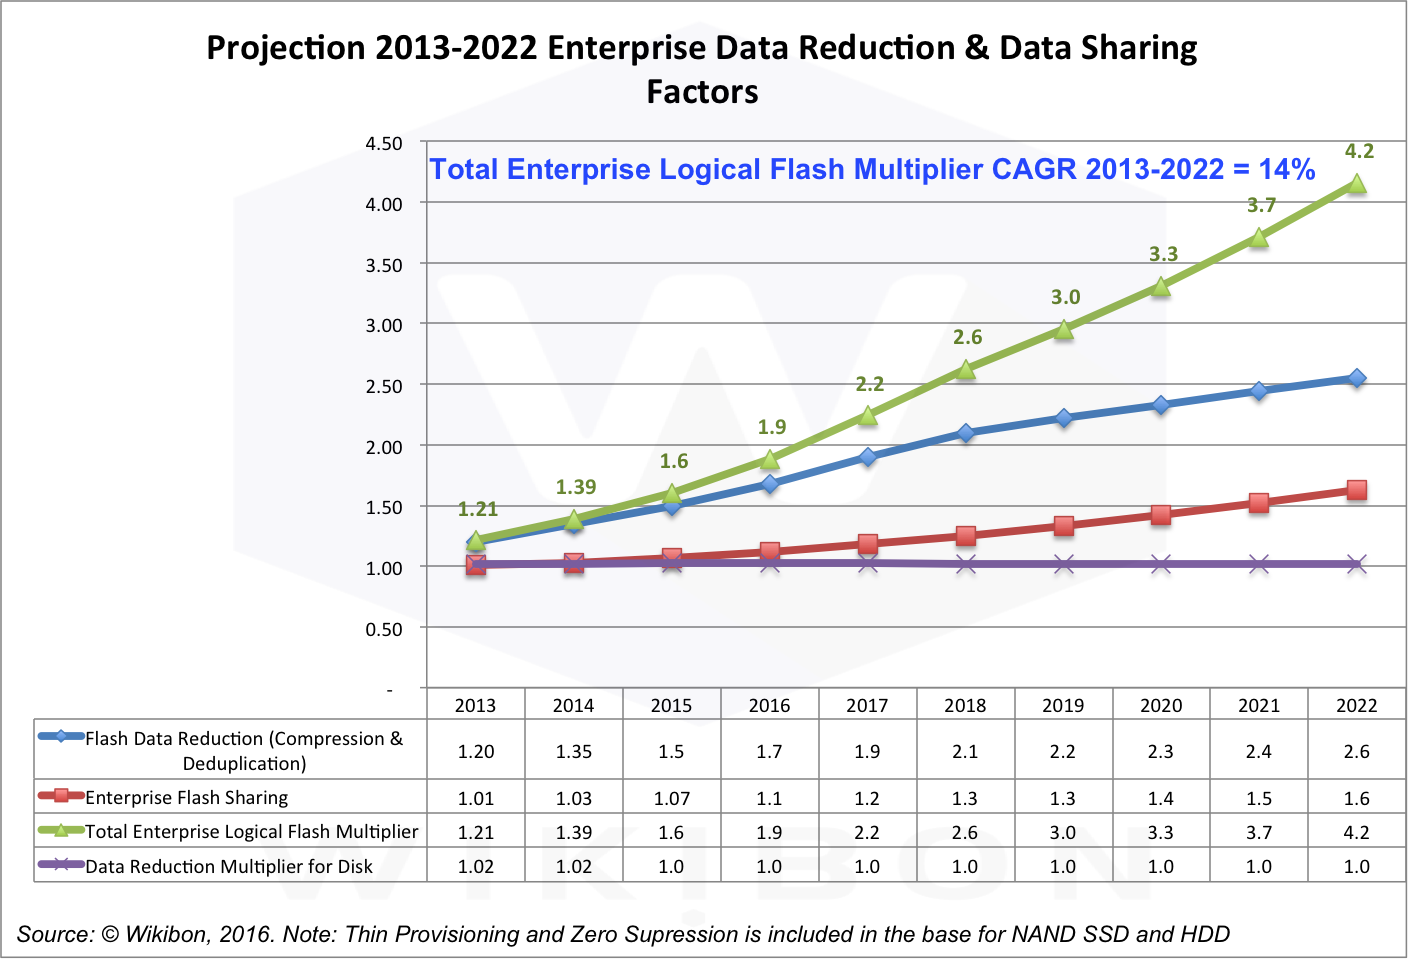
Wikibon recently researched this in detail, with the help of storage suppliers and users. Wikibon looked in detail at the actual compression and deduplication rates achieved in the field from leading flash storage suppliers (see list in Footnote1 in the Footnotes section below). Vendors are quick to point out the maximum compression and deduplication rates that can be achieved (in the order of 15-20 x). However the average improvement over HDDs is much lower, and shown in Figure 6 below. The improvements from thin provisioning and Zero suppression have been excluded as these are already included in current HDD storage technologies.
Source: © Wikibon 2016
Data Reduction for Flash
The blue line in Figure 6 shows the average impact of compression and deduplication on data stored in the data center. In 2016 Wikibon found that this figure was about 1.7, and Wikibon projects this will increase to an average of 2.4 by 2021, and will continue improving after that. These figures were based on looking at the actual figures of thousands of customers using compression and deduplication, across all data types. In some high performance applications, compression and deduplication slow computation speeds and are not used. Some types of data (e.g., video and encrypted data) cannot be compressed at all. However, Wikibon believes that in the average enterprise data center, the projections shown by the blue line can be achieved using flash technologies.
Data Sharing for Flash
The red line in Figure 6 shows enterprise data sharing. One of the key technologies that is amplified by flash is snapshotting, the ability to take one or many logical copies of data without making a physical copy, using only a small amount of metadata. Wikibon took the baseline of snapshots being available to be used in 25% of data, and the probability of a snapshot being mounted (actually used) as 5%, and the number of logical copies made was 2. The additional data created is then calculated as 25% × 5% × 2 = 2.5% additional copies actually deployed. As data centers increase the availability of snapshots, the automation of mounting the snapshots, and the number of logical copies made, the number of additional logical copies will increase from 0.1 in 2016 to 0.5 in 2021. This is a conservative estimate, and leading enterprises will deploy many more logical copies of data to applications (e.g., to the data warehouse) and knowledge workers.
The Multiplicative Combination of Data Reduction and Data Sharing
The overall impact of the blue and red lines in Figure 6 are independent and multiplicative, and is shown by the green line in Figure 6. This increases from 1.8 in 2016 to 4.2 in 2022. The implication of this is very important for enterprise data centers – one unit of HDD storage can be replaced by 0.56 physical flash storage units in 2016, and only 0.24 physical flash units in 2022. To rephrase, only 1/4 of an exabyte of flash will be required to replace an Exabyte of magnetic disk in 2022. This percentage will continue to decrease. This is also extremely important in the projection of the number of fabs that need to be constructed to replace magnetic storage. Only 29% NAND bits are required to be made to replace the magnetic bits that would have been made. Wikibon expects that enterprises and ISVs will become very smart in increasing the number of logical copies deployed on physical NAND, in the consumer, enterprise and hyperscale storage spaces.
Data Reduction and Sharing for HDD
Could the same technology be applied to magnetic storage? The answer is that it could for data with ultra low access rates, as shown by the purple line in Figure 6. However, the time and overhead to access that data would be very high, and the access density of HDDs will continue to decline going forward. Flash storage has the performance to make data sharing and data reduction a practical reality in the data center. There has been very limited uptake of data reduction except for thin provisioning and zero suppression for HDD systems, and is treated as table-stakes in the projections. Wikibon projects there will be practically no additional increase of data sharing on HDDs.
Logical Capacity Projections
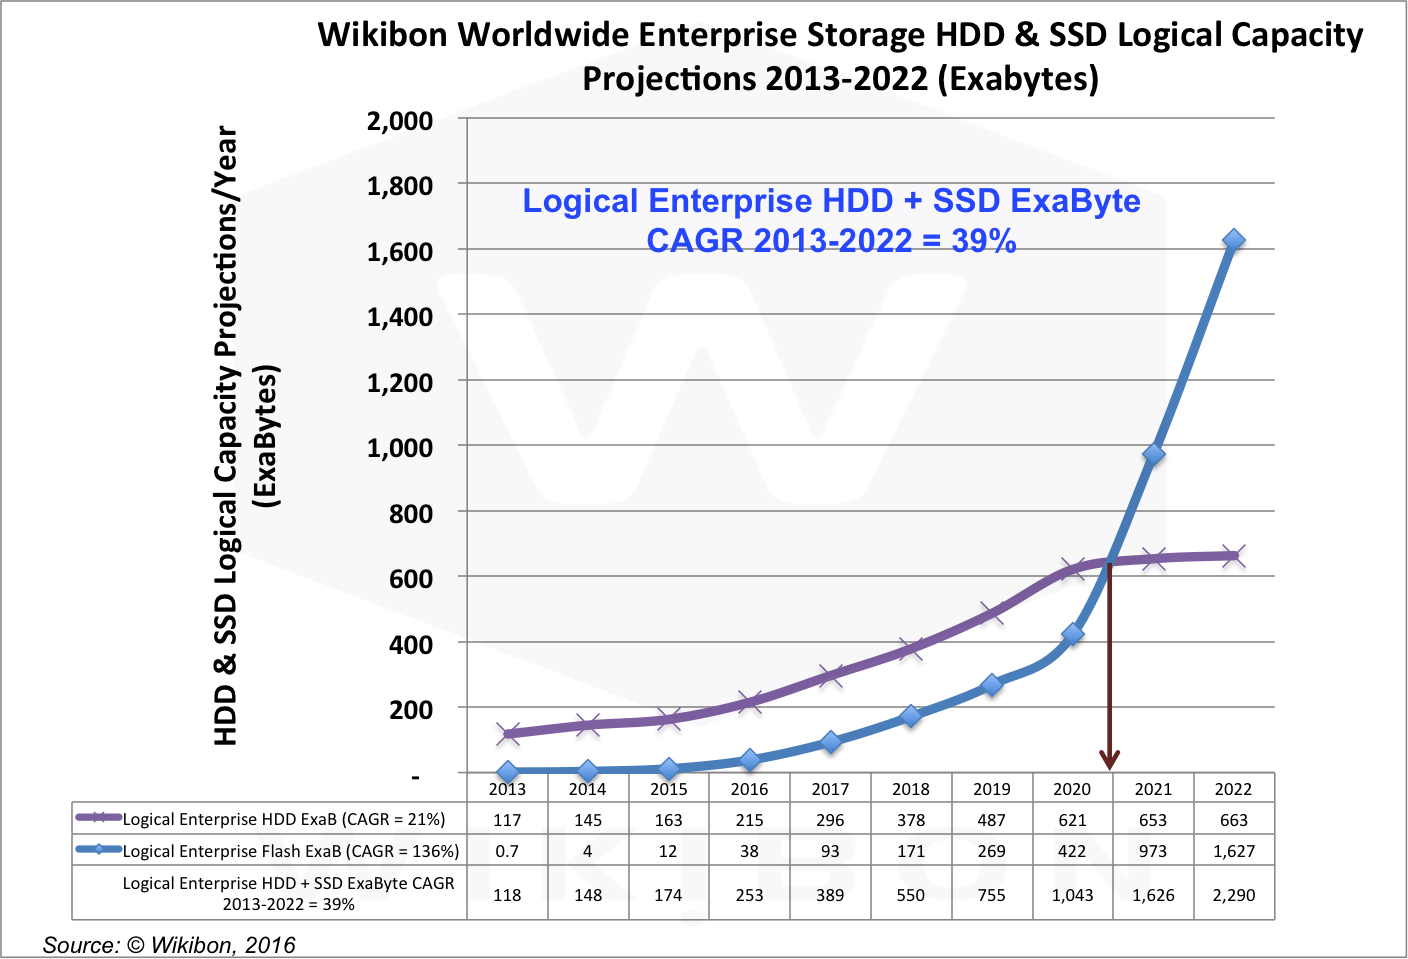
Figure 7 shows the logical capacity projections for HDD and flash enterprise storage. The 21% CAGR for HDD is derived from the 17% improvement in capacity, and the 3% increase in the number of HDD drives. The capacity of enterprise drives has been increasing rapidly in 2015 and 2016, and will continue for a time into 2017. After that time, Wikibon projects that capacity increases in drive size will tail off.
The total logical capacity at the cross-over point of the two lines is about 640 exabytes for HDD, and for flash, 1,280 exabytes in all. This is achieved at the start of 2021. From Figure 6 above, Wikibon projects a physical to logical multiplier of 3.7 for Flash. The actual physical flash that will be delivered in 2021 in exabytes will be 640 ÷ 3.7 = 173 exabytes of flash. The 173 exabytes of flash actually shipped will appear to 640 exabytes to the end users. Flash and Disk together will ship 1,280 exabytes of logical storage capacity.
Source: © Wikibon 2016. See Table 2 in Footnote3 for General Assumptions.
Conclusions
Wikibon believes that HDD drives and flash drives (or equivalent) will coexist for the next decade. Flash technologies will increasingly be used for active data, streamed data and shared data, with a broad range of data access times from 1ms to 10 microseconds and lower. This will be at the Edge for IoT (both mobile and static) as well as in large data centers. HDD drives will continue to be deployed, mainly in large data centers and increasingly for purely sequential workloads, for large object files with metadata in flash, and for compliance and archive data that is very unlikely to be read.
Like all projections, strategic IT executives and professionals should view these conclusions with a grain of salt and keep their tactical options open, be skeptical, and retain options. Suppliers (e.g., Western Digital) and enterprise IT teams that can deploy HDD and SSD technologies appropriately and cost effectively will prosper. Other magnetic storage options such as flash and tape library combinations (e.g., Flape) are also emerging with much higher bandwidth capabilities and lower costs for little accessed data compared to disk.
It should be noted that all the charts are looking at revenue and capacity increases in each year. Figure 4 above for example, shows 19% of revenue used for enterprise flash storage. However, storage is sticky and stays in datacenters for an average of 10 years, mainly because of the cost of migration from one technology to the next. Thus less than 10% of the installed storage capacity is flash in 2016.
Action Item
Data sharing is a key technology that will enable lower storage costs and high returns from improved enterprise efficiency. Executives with responsibility for IT strategy should ensure that the benefits of data sharing to IT and the enterprise are understood, and that the IT and business organizational changes are made to accelerate its adoption. Expertise and commitment to data sharing capabilities are key criteria for selecting strategic IT software and hardware suppliers. One of the key technical requirements for flash storage is a real-time cataloging system for logical data to ensure performance, availability and compliance.
Footnotes
Footnote1: Vendors who participated in this research include EMC, HPE, IBM, Pure Storage, SanDisk (now acquired by Western Digital), and Western Digital. Wikibon thanks them all for their active participation and practical help.
Footnote2: Source for Figure 1 density calculations
Source: © Wikibon 2016
Footnote3: Global Forecast Assumptions
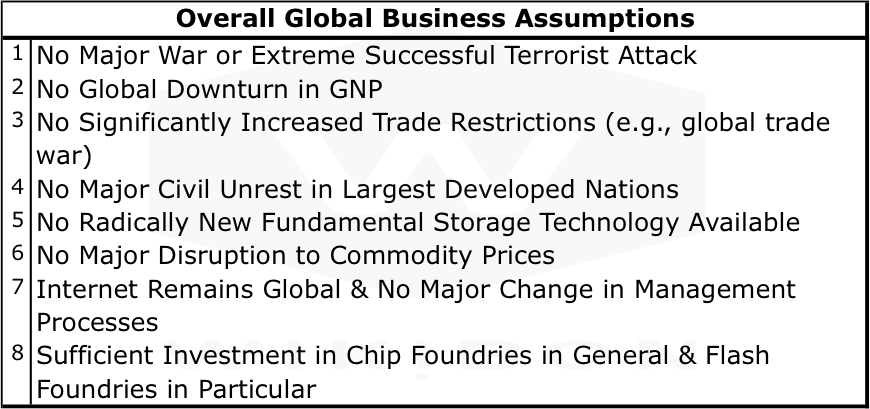
Source: © Wikibon 2016