
CTO & Co-founder, Wikibon
Executive Summary
In order to understand the impact of flash technologies within the data center, it is important to understand the storage technology and costs projections. This research looks in detail at storage technology cost projections for the next five years, 2015-2020.
The detailed bottom line forecast in shown in Figure 1 below. The left hand axis is $/effective TB, with flash needing far less physical storage to meet the logical capacity demands. The reduction in flash capacity comes from data reduction technologies (compression and deduplication) and data sharing. Data sharing is a new general concept that works much better with flash, and allows one physical copy of data to create many logical copies, instead of making more physical copies.
Wikibon concludes that with the implementation of datacenter best-practice processes, the IT budget cost of datacenter adoption of capacity all-flash technology for currently installed applications will be lower cost than capacity magnetic disk in 2016, four times lower in 2018 and will be eight times lower by 2020. Wikibon strongly recommends CIOs take a strategic decision to move to an all-flash datacenter strategy by 2016.

Source: © Wikibon 2015. See Table Footnotes-1 in the Footnotes below for the full set of assumptions
Capacity Storage Technology Projections 2015-2020
Figure 2 shows the cost projections for capacity flash and and capacity magnetic disk 2015-2020. The green line shows the raw cost of flash declining at about 30%/year, driven by an insatiable demand for flash in smartphones, video cameras, thumb drives, wearables and the internet of things. There is very strong investment in new flash technologies, with new fabs for the next generation of 3D flash being built worldwide. Because much less physical flash storage will be required to replace the magnetic disks in enterprises, there is little danger that there will not be enough flash storage to meet demand.
The cost of disk storage is declining by about 15%, as PC laptops and desktops decline, with the percentage of these devices with magnetic drives expected to drop below 50% by 2018. Flash has already taken over the market from performance (10K & 15K) magnetic disk drives, and investment has completely dried up for future performance magnetic disk drives. The enterprise capacity magnetic disk market is buoyed up at moment by sales to the mega-hyperscale infrastructure companies, but Wikibon expects the overall magnetic disk market to soften over the next few years.
Figure 2 shows that the raw technology costs of magnetic disk and capacity flash are converging, but even by 2020 the curves will not have crossed over. The next section looks at the how the difference in performance of flash changes the equation.
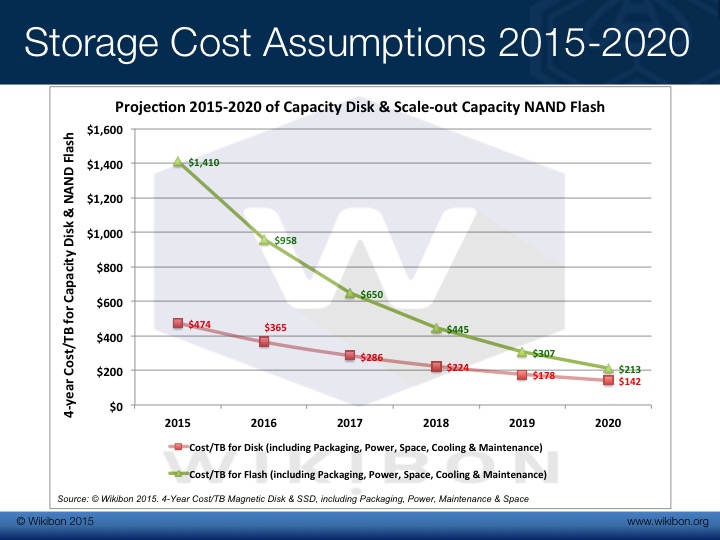
Source: © Wikibon 2015. The $/Terabyte includes 4-year cost of packaging, power, space, cooling & maintenance. The detailed assumptions can be found in Table Footnotes-1 in the Footnotes.
The Impact of Compression, Deduplication & Data Sharing on Capacity Flash Requirements
Figure 3 below shows the impact of data reduction techniques on the capacity requirement. The green line shows the projections for datacenter-wide reduction devisors for compression and deduplication combined. Wikibon is assuming a factor of two (2) in 2015, growing to 4 in 2020. Although there are many workloads such as VDI which demonstrate much higher values (and they have historically been the workloads that have moved to flash first), there are many workloads with much lower compression and deduplication ratios (e.g., video, one of the fastest growing storage capacity workloads).
The purple line shows a new concept in storage management, data sharing. The technology of space efficient snapshots has been around for some time in traditional storage arrays. This allows a snapshot copy to be taken, and the only additional data that is required is metadata about the snapshot and a delta dataset of any updates to the original file or volume. This is used extensively to create snapshots for recovery purposes, so that in the event of any hardware or software corruption of data, a consistent point can be chosen to recover from, the system repaired, and the transaction logs are reapplied to recover. These snapshots allowed faster recovery and very little additional storage, but do not last for extended periods of time, and the data is certainly not shared between applications. Another type of snapshot taken is the snapshot clone, where a true additional copy at a point in time is taken of files or volumes. Space efficient snapshots would have been much more efficient, but because of the IO and bandwidth performance limitations of magnetic storage devices, the sharing data (say) between a transactional system and a data warehouse would bring both systems down because of contention for resources.
Flash changes that completely. Flash has no mechanical constraint, has sufficient IOPS and bandwidth to allow this data sharing, and over time the IOPS and bandwidth will continue to improve in line with Moore’s law. Capacity disks have reached an effective end of performance capability because of mechanical constraints.
The purple line starts at 1.5x in 2015. This cautious assessment is because datacenters have been designed round NOT sharing data, but copying data. Tiering software constantly copies data from tier to another to reduce cost. Copies of transactional data are taken to feed data warehouse, data lakes, web front-ends, and many other uses. Data copying takes between 20% and 30% of all server cycles in a typical datacenter. Data is religiously separated from each other in different storage pools.
The biggest challenge facing CIOs is to change the mindsets and processes within the traditional datacenter, and move towards an application centered workflow, where the data can be shared between applications and application suites. The instincts of storage professionals will be to copy data off to low performance disks. Prerequisites for success in moving to a shared data environment include:
- Great leadership from the top;
- Good data management tools which allow deep understanding of the physical and logical views, the mapping of them all and the performance of them all;
- Great QoS tools to manage IOPS & bandwidth minimums, maximums and peak for all copies both individually and severally;
- Great snapshot catalog tools to put processes in place for automatic snapshot lifecycle management, and the tools to automate recovery, compliance and security reporting;
- APIs from the storage systems that allow the data to be collected across the all the flash devices.
The really good news is that flash devices are so much faster and more consistent than traditional magnetic-based storage systems that the performance work normally required will drop dramatically. The infrastructure staff of all the early flash-only installations have been strong advocates after initial skepticism. More can be read at Wikibon research “Changing Mindsets from Magnetic Storage Tiering to Flash Data Sharing”
Wikibon believes that with the implementation of good datacenter practices, and laser focus and moving to a shared data environment, the amount of data sharing can be improved steadily to 6x by 2020. This is shown in the purple line in Figure 3.
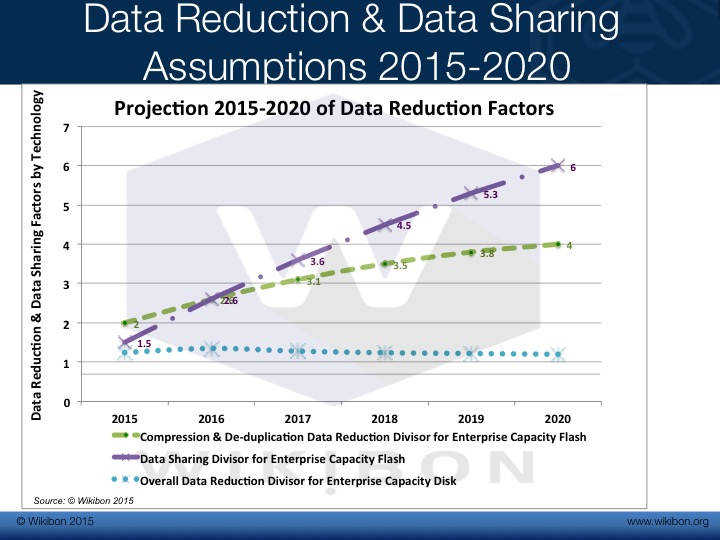
Source: © Wikibon 2015, see Table Footnotes-1 in Footnotes for details on assumptions
Figure 4 shows the potential benefits from applying data reduction techniques (compression and deduplication) and data sharing techniques. The two effects are multiplicative, and they represent the reduction in the amount of flash storage that is need to support the current workloads. The 2015 figure is 2 x 1.5 = 3x reduction in flash required to be installed, compared with traditional disk storage systems. This reduction is projected to rise steadily to 4 x 6 = 24x in 2020, assuming good people and good processes are in place. This completely changes the business case for migrating to an all-flash datacenter, changes the way that data is managed and amplifies the opportunities for improving applications with more data more quickly.

Source: © Wikibon, 2015, see Table Footnotes-1 for assumptions and calculation of the data in Figure 4.
Impact of Data Reduction & Data Sharing on Storage Costs
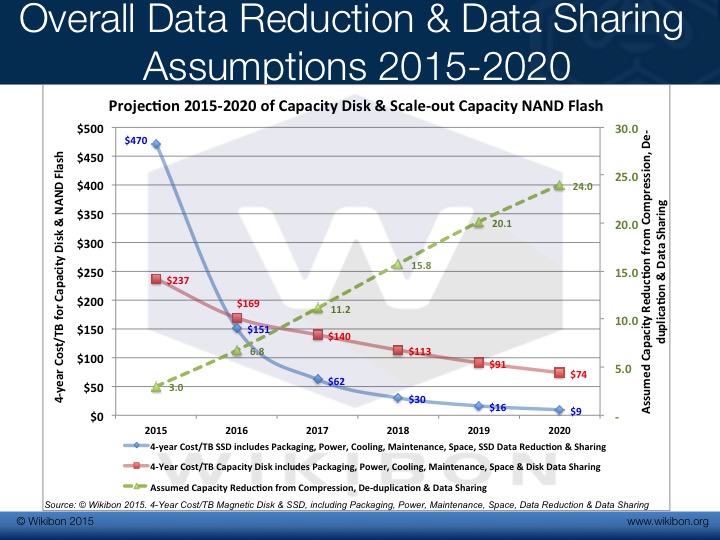
Figure 5 shows the impact of data reduction and data reduction + data sharing on the cost of flash and transitional disk storage. The top purple line is the same as in Figure 2. The green line shows the cost impact of data reduction (compression and deduplication) on the amount of flash required, and therefore on the IT cost of flash storage. It crosses the red line (the same as in Figure 2, with a small amount of magnetic disk data reduction capability, see Table Footnotes-1 for detailed assumptions) in 2018.
The blue line shows the impact of data reduction + data sharing on the amount of flash storage required, and hence the effective cost of flash storage compared with the magnetic disk based storage. It crosses the red line in 2016. The blue line become one quarter of the price of magnetic disk in 2018, and eight time cheaper in 2020.

Source: © Wikibon 2015, see Table Footnotes-1 in Footnotes for assumptions and calculations
Figure 6 is similar to Figure 1 in the executive summary, with the free gotten line showing the overall reduction in the amount of physical flash that has to be installed in an all-flash environment, compared with traditional disk drives.
Source: © Wikibon, 2015, see Table Footnotes-1 for the detailed assumptions and calculations
Action Item:
Wikibon recommends that CIOs put in place a four-point plan for implementing an all-flash datacenter strategy::
- Migrate to All-flash Datacenter by 2016
- Implement of proof of concept for Developer Data Sharing (low hanging fruit for success, implement an initial set of new procedures to (say) automate publication of copies from production to development.
- Expect 2 x Productivity from better & earlier developer access to databases, code and data, and faster response times
- Expect > 3 x Code Quality from developers with ability to drive complete testing earlier in the development cycle
- Reorganize Data Center Operations around the Principle of Application Data Sharing
- Use Budget Savings* to Fund Systems of Intelligence
* See Top Ten Reasons why CIOs Should Migrate to All-flash Datacenters by 2016
Future Research
Wikibon focuses its research on disruptive technologies in Big Data Analytics, the Road from Data Warehousing to Systems of Intelligence, the Internet of Things, Cloud Infrastructure, Platforms and Software, Software-led Infrastructure, Server SAN/Hyperscale, Flash as an enabler of increased data and Flash-as-an-extension-of-memory for the future high performance enterprise systems. Wikibon will be developing specific storage projections that will focus on the re-integration of compute, flash storage and networking into clustered node systems.
Video
The following Wikibon video “Storage Projections to an All-flash Datacenter in 2016” goes through the presentation and spends additional time on the recommendations for CIOs.
Footnotes
Table Footnotes-1 shows all the assumptions behind Figures 1 to Figure 8 above.
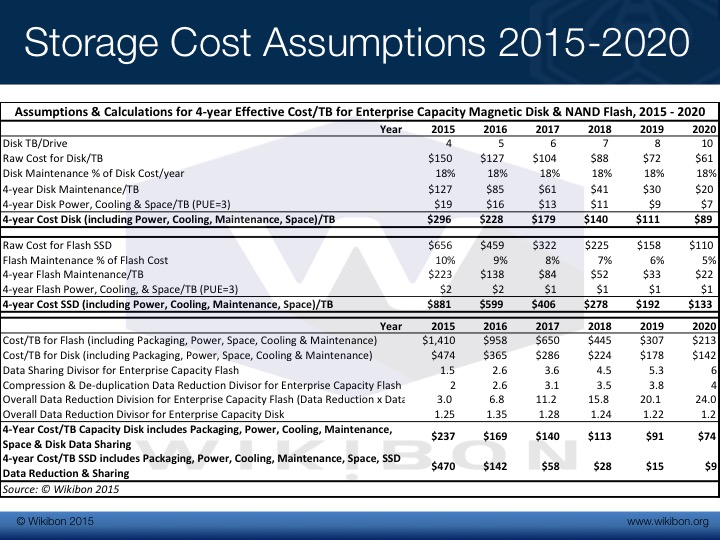
Source: © Wikibon 2015